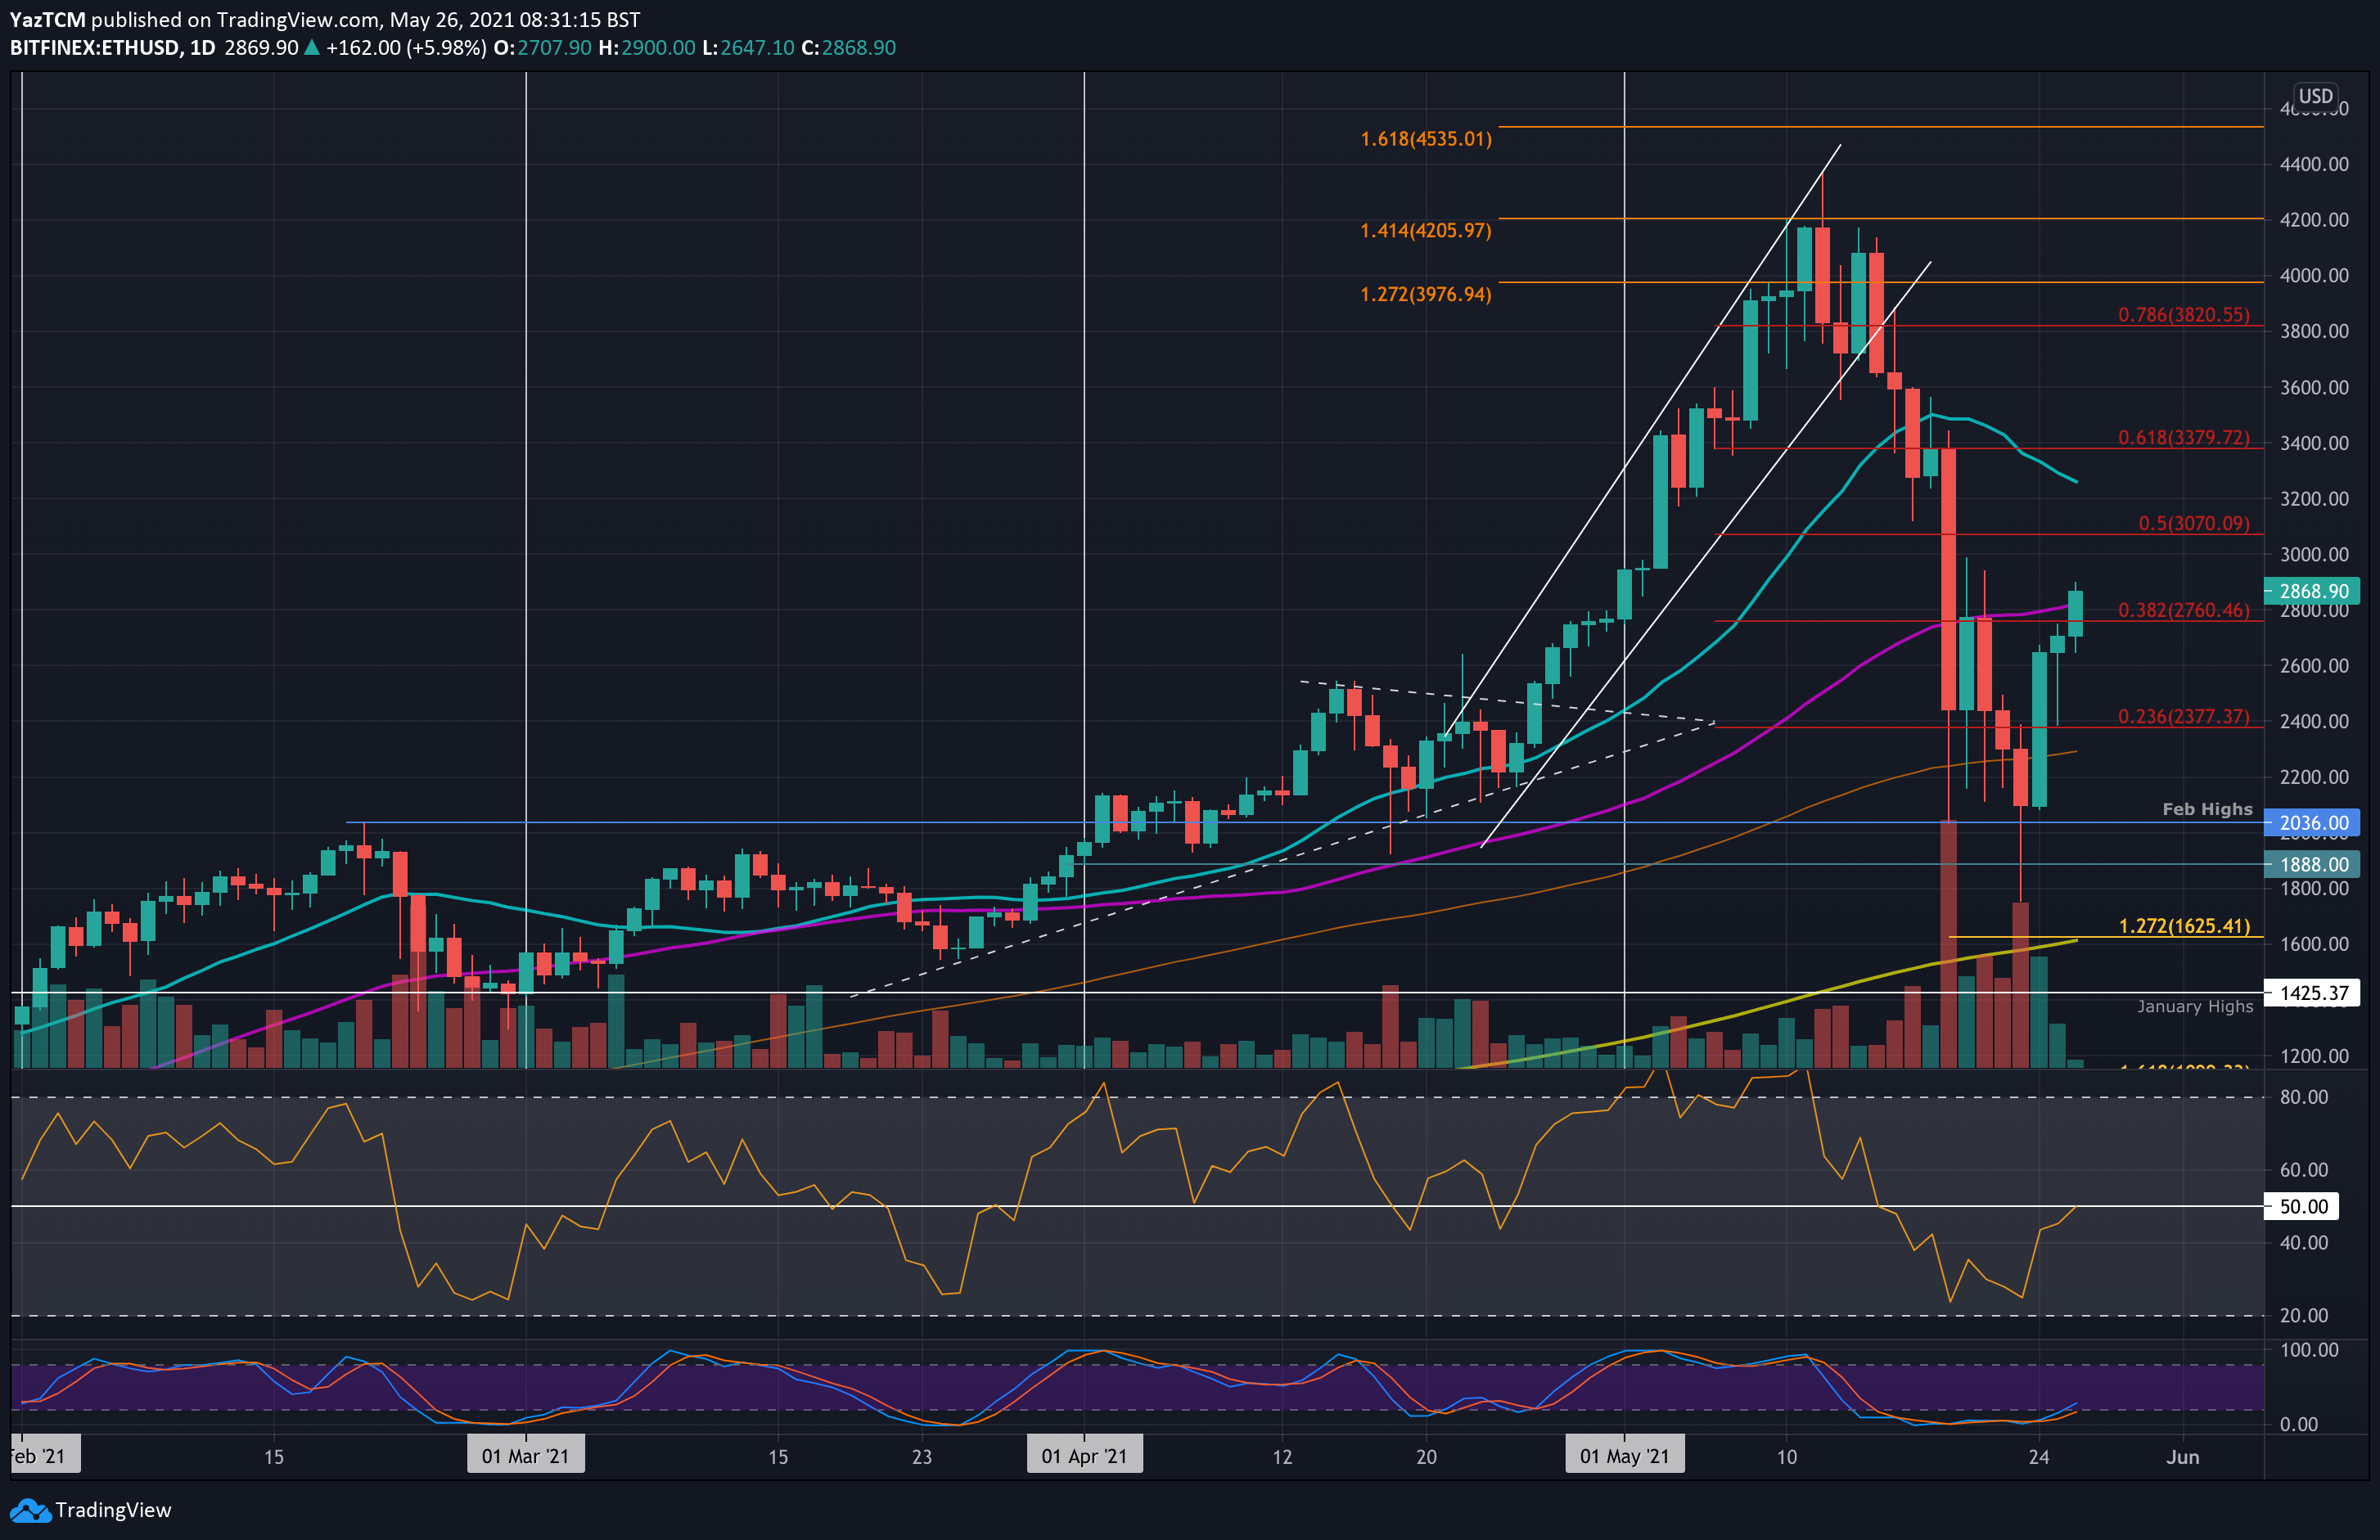
ETH/USD Daily Chart. Source: TradingView
Key Support Levels: $2800, $2600, $2380.
Key Resistance Levels: $3000, $3070, $3250.
ETH is attempting a recovery from last week’s market capitulation with a 9.7% price hike today, allowing it to break above $2800 and climb beyond the 50-day MA again. The cryptocurrency fell beneath the 50-day MA last week during the cryptocurrency market correction as it dropped to $2400.
The ETH price drop continued over the weekend, falling as low as $1800 on Sunday. However, the bulls did manage to close Sunday’s daily candle above $2000. Since the weekend, ETH has been rebounding and is now up by 37% since Monday.
Additionally, today’s price hike allowed ETH to break resistance at $2760, provided by a bearish .382 Fib Retracement.
Looking ahead, the first level of higher resistance lies at $3000. This is followed by $3070 (bearish .5 Fib), $3250 (20-day MA), and $3380 (bearish .618 Fib).
On the other side, the first support now lies at $2800 (50-day MA). This is followed by $2600, $2380, $2300 (100-day MA), and $2050 (Sunday’s closing price).
The RSI has now returned back to the midline, indicating that the bearish momentum has dissipated, and the market is now in a state of indecision.
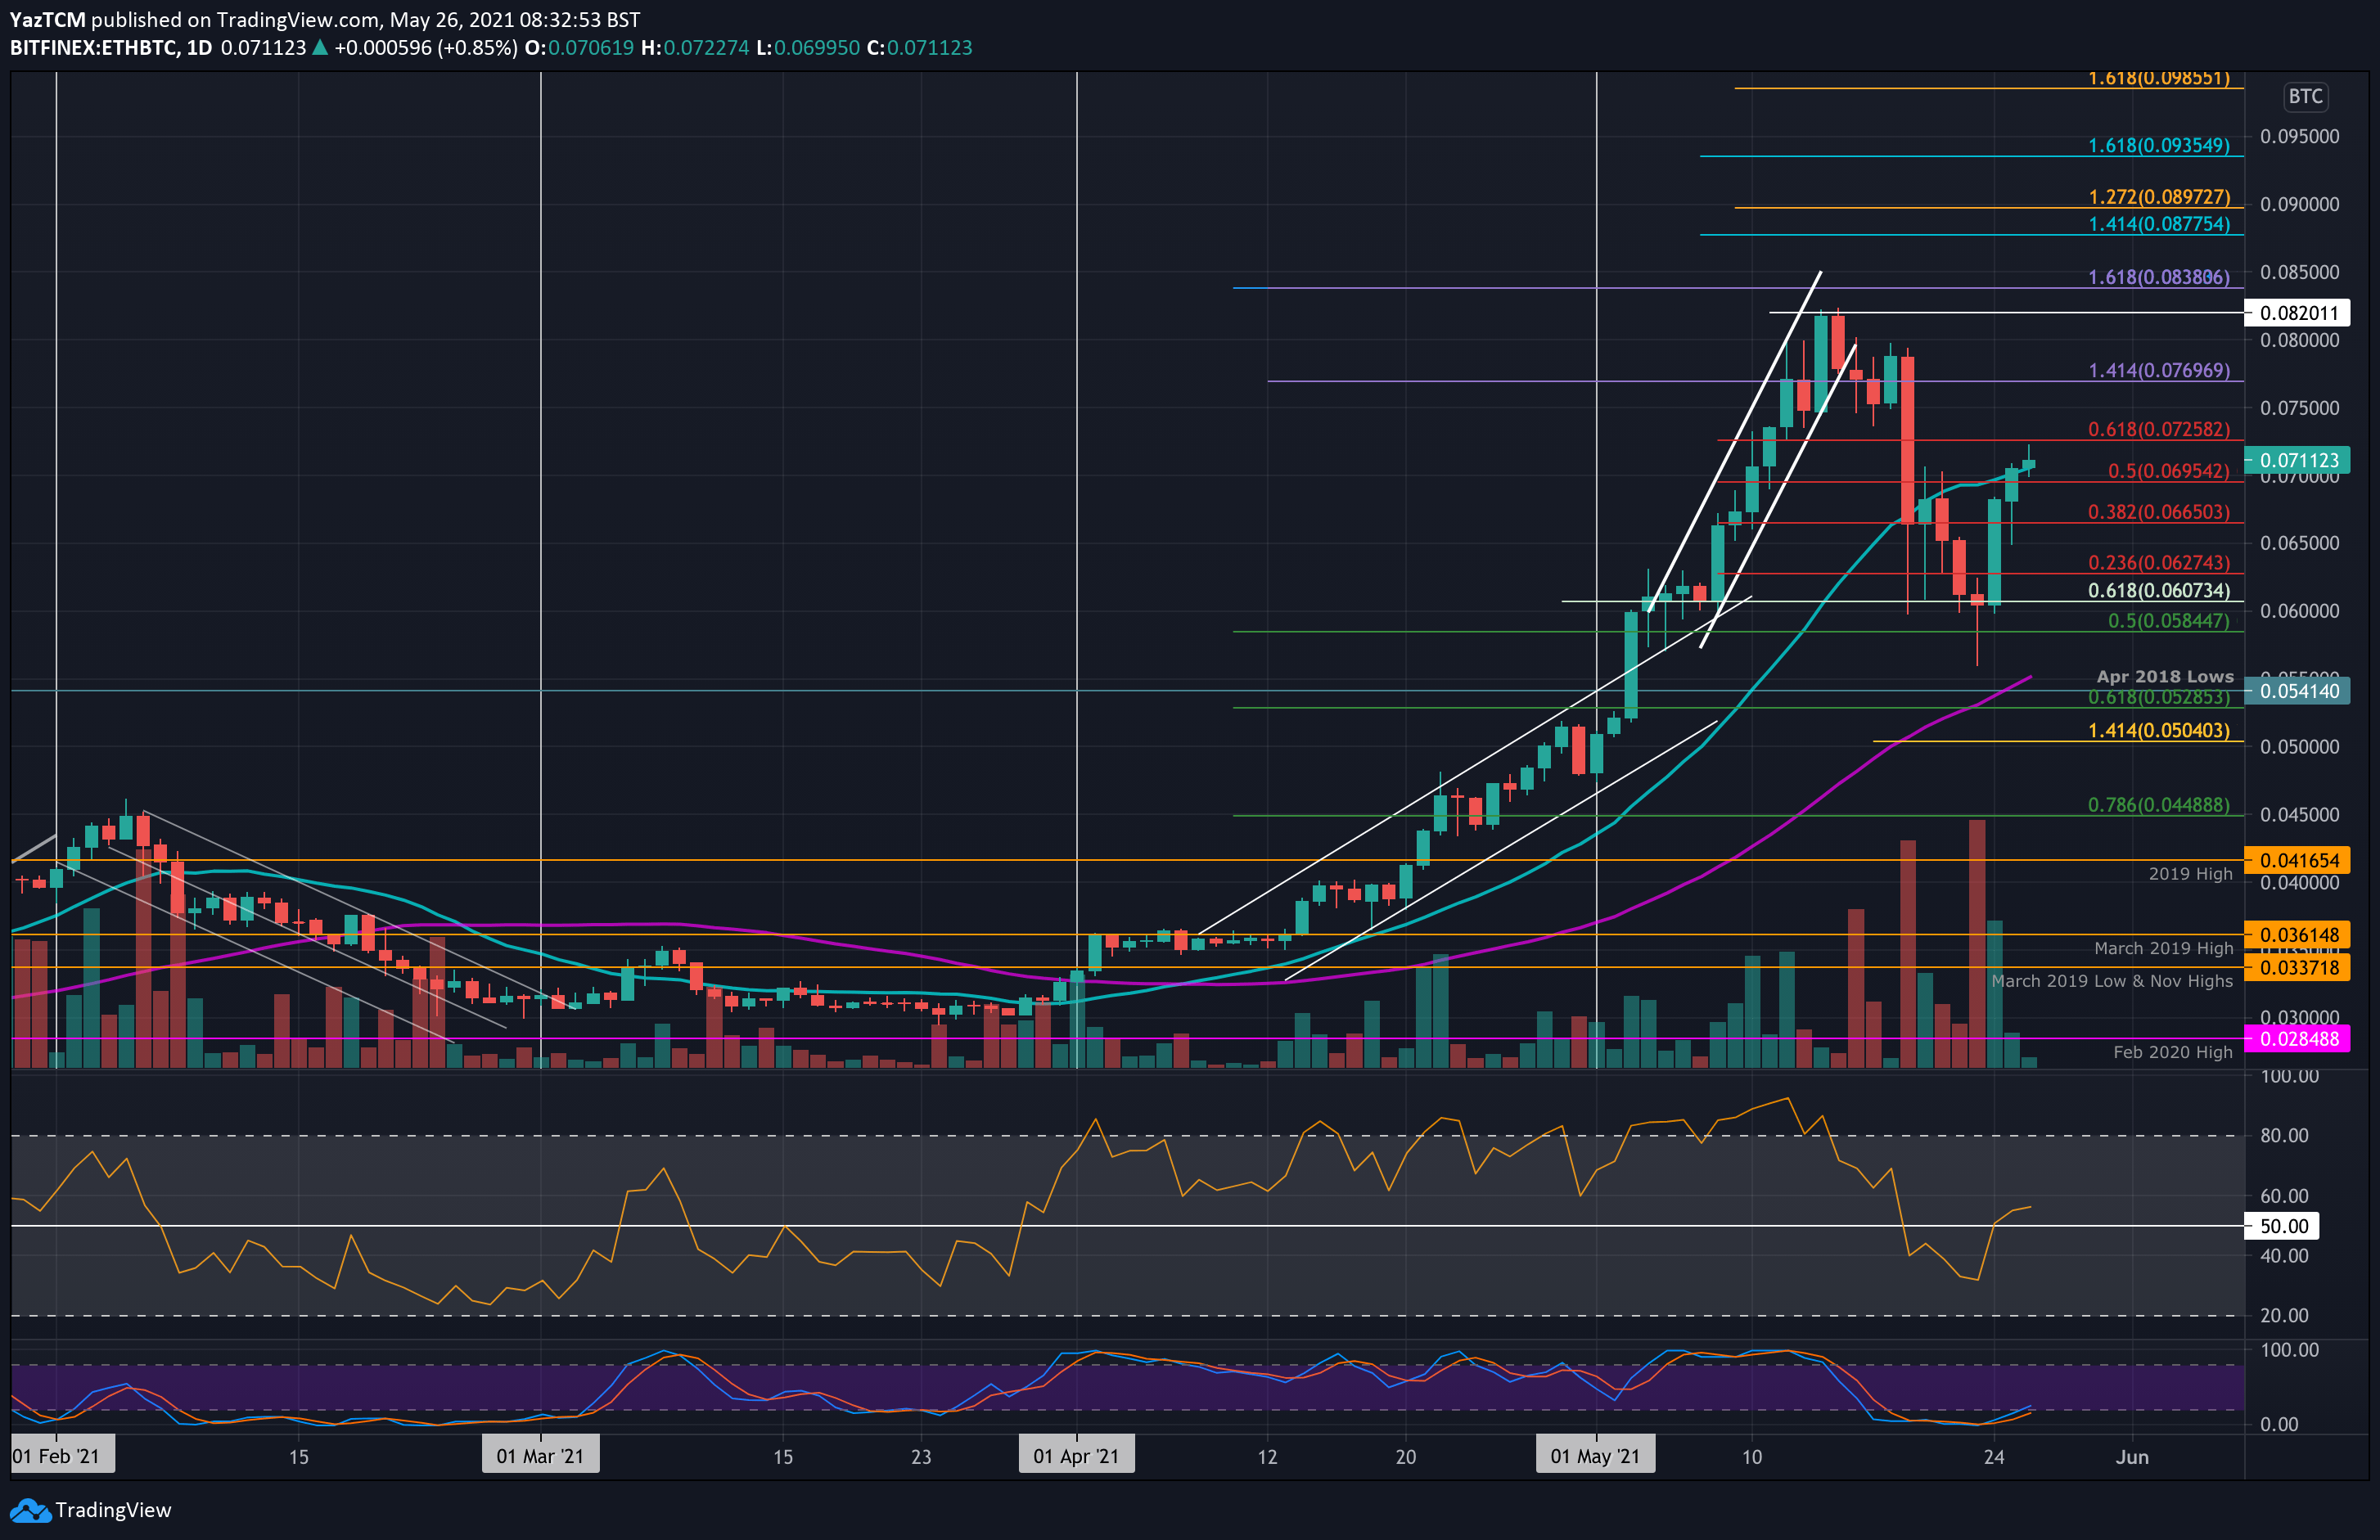
Key Support Levels: 0.07 BTC, 0.0665 BTC, 0.065 BTC.
Key Resistance Levels: 0.072 BTC, 0.075 BTC, 0.077 BTC.
Ethereum is also performing very well against BTC. The cryptocurrency fell to 0.06 BTC on Sunday after spiking as low as 0.056 BTC. The support here was provided by a short-term .618 Fib Retracement level.
Since then, ETH has bounced higher over the past three days to break resistance at 0.07 BTC (20-day MA & bearish .5 Fib) and reach as high as 0.0725 BTC (bearish .618 Fib) today.
Looking ahead, if the bulls can break 0.072 BTC (bearish .618 Fib), the first resistance lies at 0.075 BTC. This is followed by 0.077 BTC (1.414 Fib Extension), 0.08 BTC, and 0.082 BTC (May highs).
On the other side, the first support lies at 0.07 BTC (20-day MA). This is followed by 0.0665 BTC, 0.065 BTC, and 0.06 BTC.
The RSI is now in the weak bullish territory as it pokes back above the midline. For a recovery toward the May highs, the RSI must continue to make a higher high to indicate increased bullish momentum.