After breaking up higher and hitting the $170 level, the Ethereum market has now turned downward as the coin loses 15% over the past 24 hours of trading, bringing the current trading price down to around $140, at the time of writing.
Despite this significant decline, the market is still up by a total of 18% over the previous 30 days.
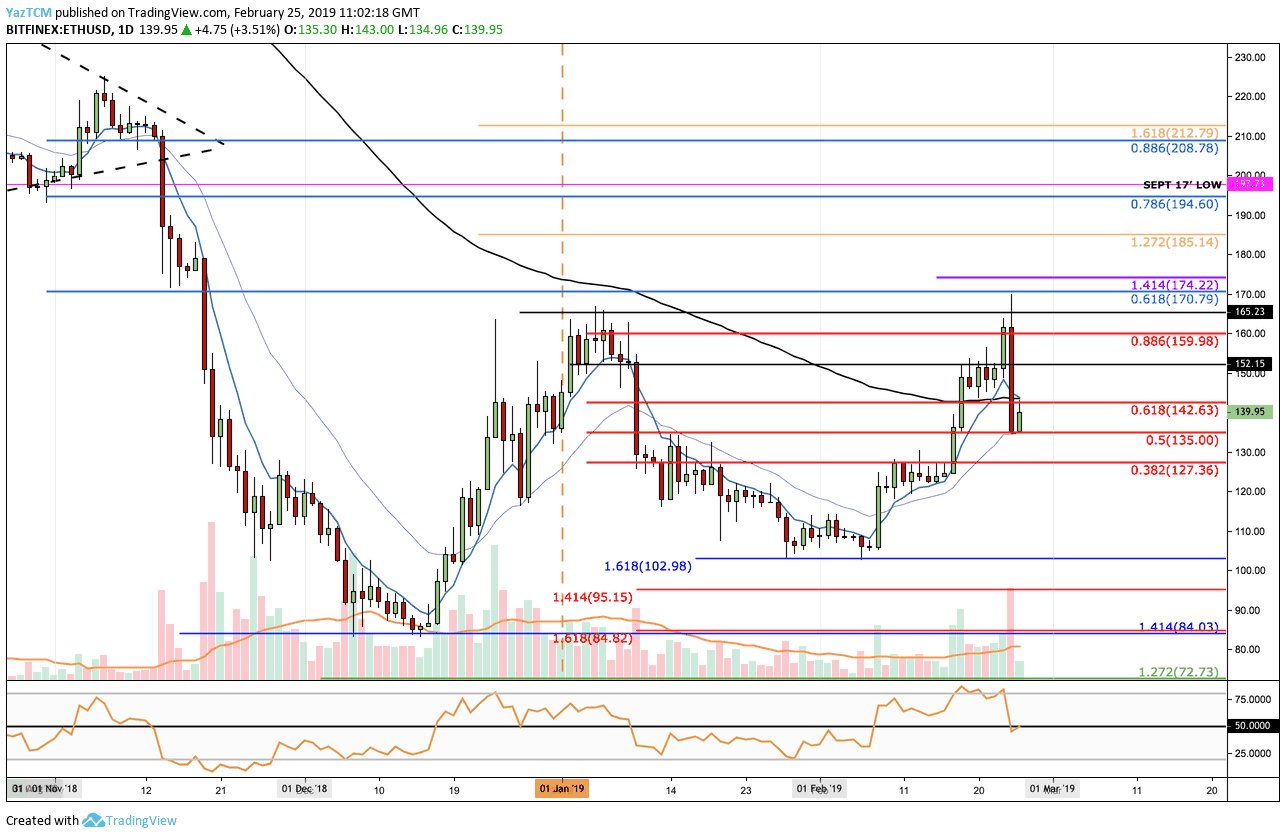
Looking at the ETH/BTC 1-Day Chart:
- Following our previous analysis, we can see ETH/USD breaking above the resistance at the $152 level. The market then went on to surge until resistance was met at the $170 level. After reaching the $170 handle the market then rolled over and dropped precipitously into support at the short term bearish .5 Fibonacci Retracement level (drawn in red) priced at $135.
- The Ethereum coin has now broken below the 100-day moving average, once again.
- From below: The nearest support beneath $135 is located at the bearish .382 Fibonacci Retracement level (marked in red) located at $127. Support below this lies at $120, $110 and $103.
- From above: The nearest resistance now lies at $142 followed by $152. If the buyers continue above $152, we can expect more resistance at $160 and $170.
- If the bullish momentum continues to drive ETH/USD above $170 then higher resistance lies at $185, $197, and $200.
- The trading volume has increased over the past day, which caused the market to fall significantly.
- The RSI has now dropped into the 50 zone, which indicates the indecision in the market. If the RSI breaks below 50, we can expect further price drops moving forward.
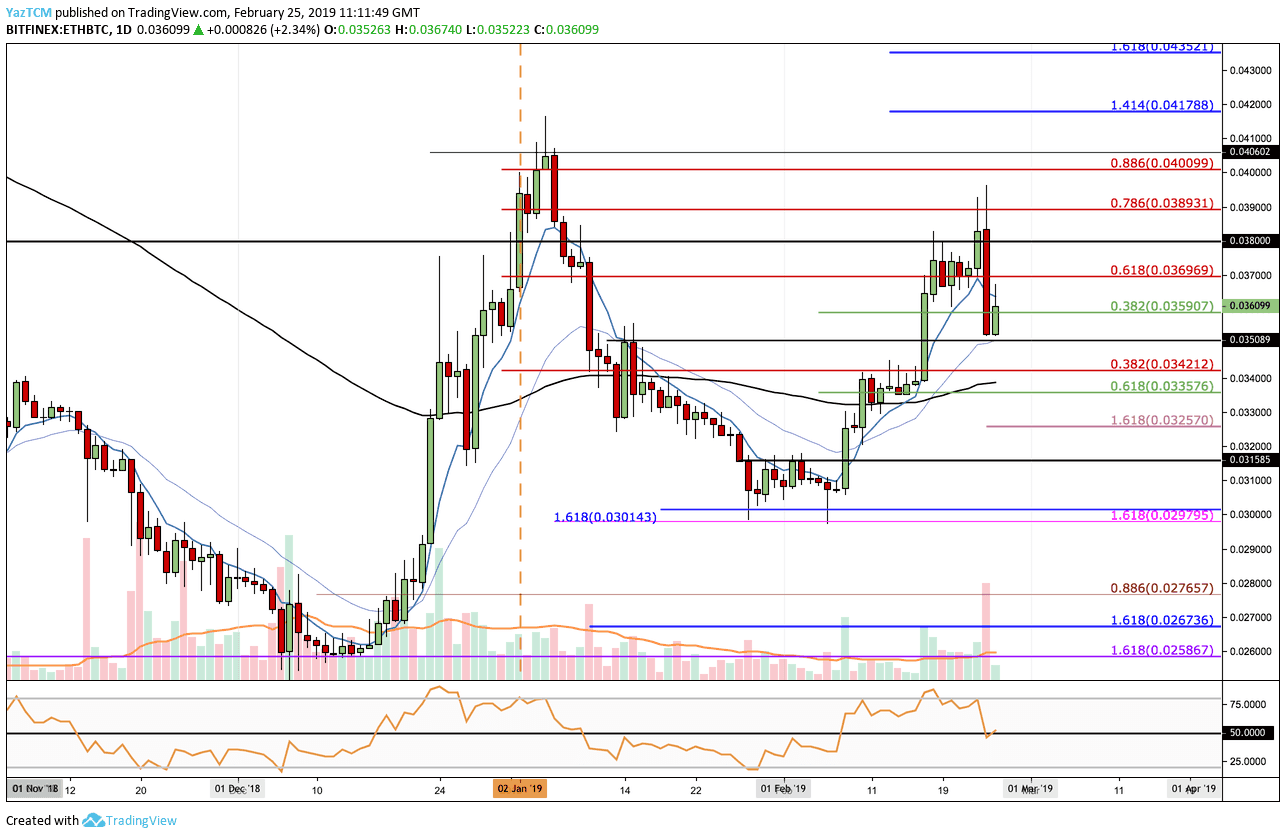
Looking at the ETH/BTC 1-Day Chart:
- ETH/BTC had also managed to surge higher, since our last analysis, rising into resistance at the 0.0396 BTC level. After reaching this resistance, we can see that the market fell and dropped to a low of 0.03522 BTC.
- ETH/BTC is currently trading above support at the short term .382 Fibonacci Retracement level (marked in green) at 0.035907 BTC.
- From below: The nearest support lies at 0.0350 BTC followed by 0.03421 BTC.
- If ETH/BTC drops below 0.03421 BTC, we can expect more support at the short term .618 Fibonacci Retracement level (marked in green) at 0.03357 BTC and then 0.03257 BTC.
- From above: The nearest resistance lies at 0.03696 BTC (bearish .618 Fib) followed by 0.038 BTC. Resistance above this then lies at 0.03893 BBTC (bearish .786 Fib) and 0.040 BTC (bearish .886 Fib).
- The trading volume has surged on the last day.
- The RSI is also trading at the 50 zone, indicating the indecision within the market.
SPECIAL OFFER (Sponsored)
LIMITED OFFER 2024 for CryptoPotato readers at Bybit: Use this link to register and open a $500 BTC-USDT position on Bybit Exchange for free!
Disclaimer: Information found on CryptoPotato is those of writers quoted. It does not represent the opinions of CryptoPotato on whether to buy, sell, or hold any investments. You are advised to conduct your own research before making any investment decisions. Use provided information at your own risk. See Disclaimer for more information.
Cryptocurrency charts by TradingView.