The ETH market has seen a recent price surge: a remarkable 10% over the past 24 hours of trading, getting the ETH price action up to over $140, at the time of writing.
The market cap of Ethereum is currently $14.5 billion as it comfortably sits in the second position of the largest cryptos by market cap.
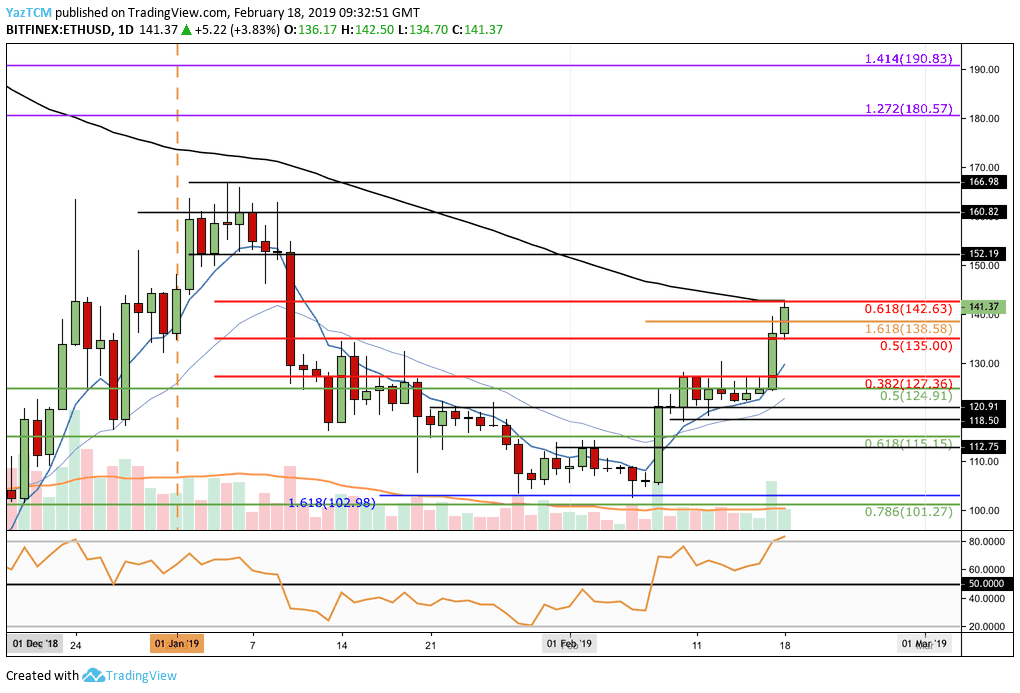
Looking at the ETH/USD 1-Day Chart:
- Following our previous analysis, we can see that Ethereum had held the support at the $120 area. The market surge had broken through resistance levels of $127.36, $130, $135 and $138.58.
- ETH/USD is now facing resistance at the bearish .618 Fibonacci Retracement level (marked in red) located at $142.63. This level of resistance is further bolstered by the 100-day moving average line which currently hovers around the same price level.
- From above: If the bulls can break up $142.63, the next resistance lies at $150 followed by $152 and $160.82.
- The current 2019 high lies at $166.98, breaking above is likely to send ETH to re-test medium term 1.272 ($180) and 1.414 ($190) Fibonacci Extension levels (marked in purple).
- From below: Nearest support lies at the bearish .5 ($135) and .382 ($127) Fibonacci Retracement levels (marked in red).
- Further support beneath lies at $120.91, $115.15 and $112.75.
- The RSI is currently in the overbought territories which may indicate that price action may pull back before climbing higher.
- The trading volume has increased over the past three days (which is bullish).
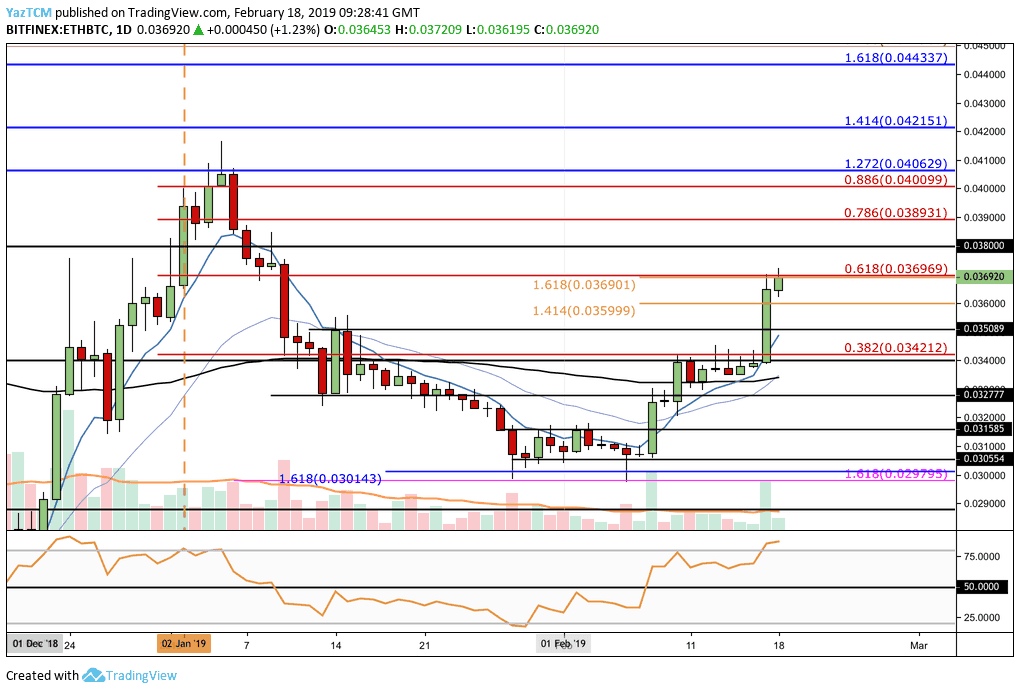
Looking at the ETH/BTC 1-Day Chart:
- ETH/BTC has also surged into resistance by the bearish .618 Fibonacci Retracement level (marked in red) located at 0.036969 BTC.
- From Above: Resistance is initially located at 0.038 BTC followed by further resistance at the .786 (0.03893 BTC) and .886 (0.040099 BTC) Fibonacci Retracement levels (marked in red).
- Resistance above 0.041 BTC is expected in the long term 1.414 (0.042151 BTC) and 1.618 (0.44337 BTC) Fibonacci Extension levels (marked in blue).
- From Below: Alternatively, closest support below lies at the previous short term 1.414 Fibonacci Extension level (marked in orange) found036 BTC.
- Below lie the035089 BTC, 0.032777 BTC, and 0.031585 BTC support levels.
- The RSI has reached overbought territory on the daily chart.
- The volume has significantly increased over the past 24 hours.
SPECIAL OFFER (Sponsored)
LIMITED OFFER 2024 for CryptoPotato readers at Bybit: Use this link to register and open a $500 BTC-USDT position on Bybit Exchange for free!
Disclaimer: Information found on CryptoPotato is those of writers quoted. It does not represent the opinions of CryptoPotato on whether to buy, sell, or hold any investments. You are advised to conduct your own research before making any investment decisions. Use provided information at your own risk. See Disclaimer for more information.
Cryptocurrency charts by TradingView.