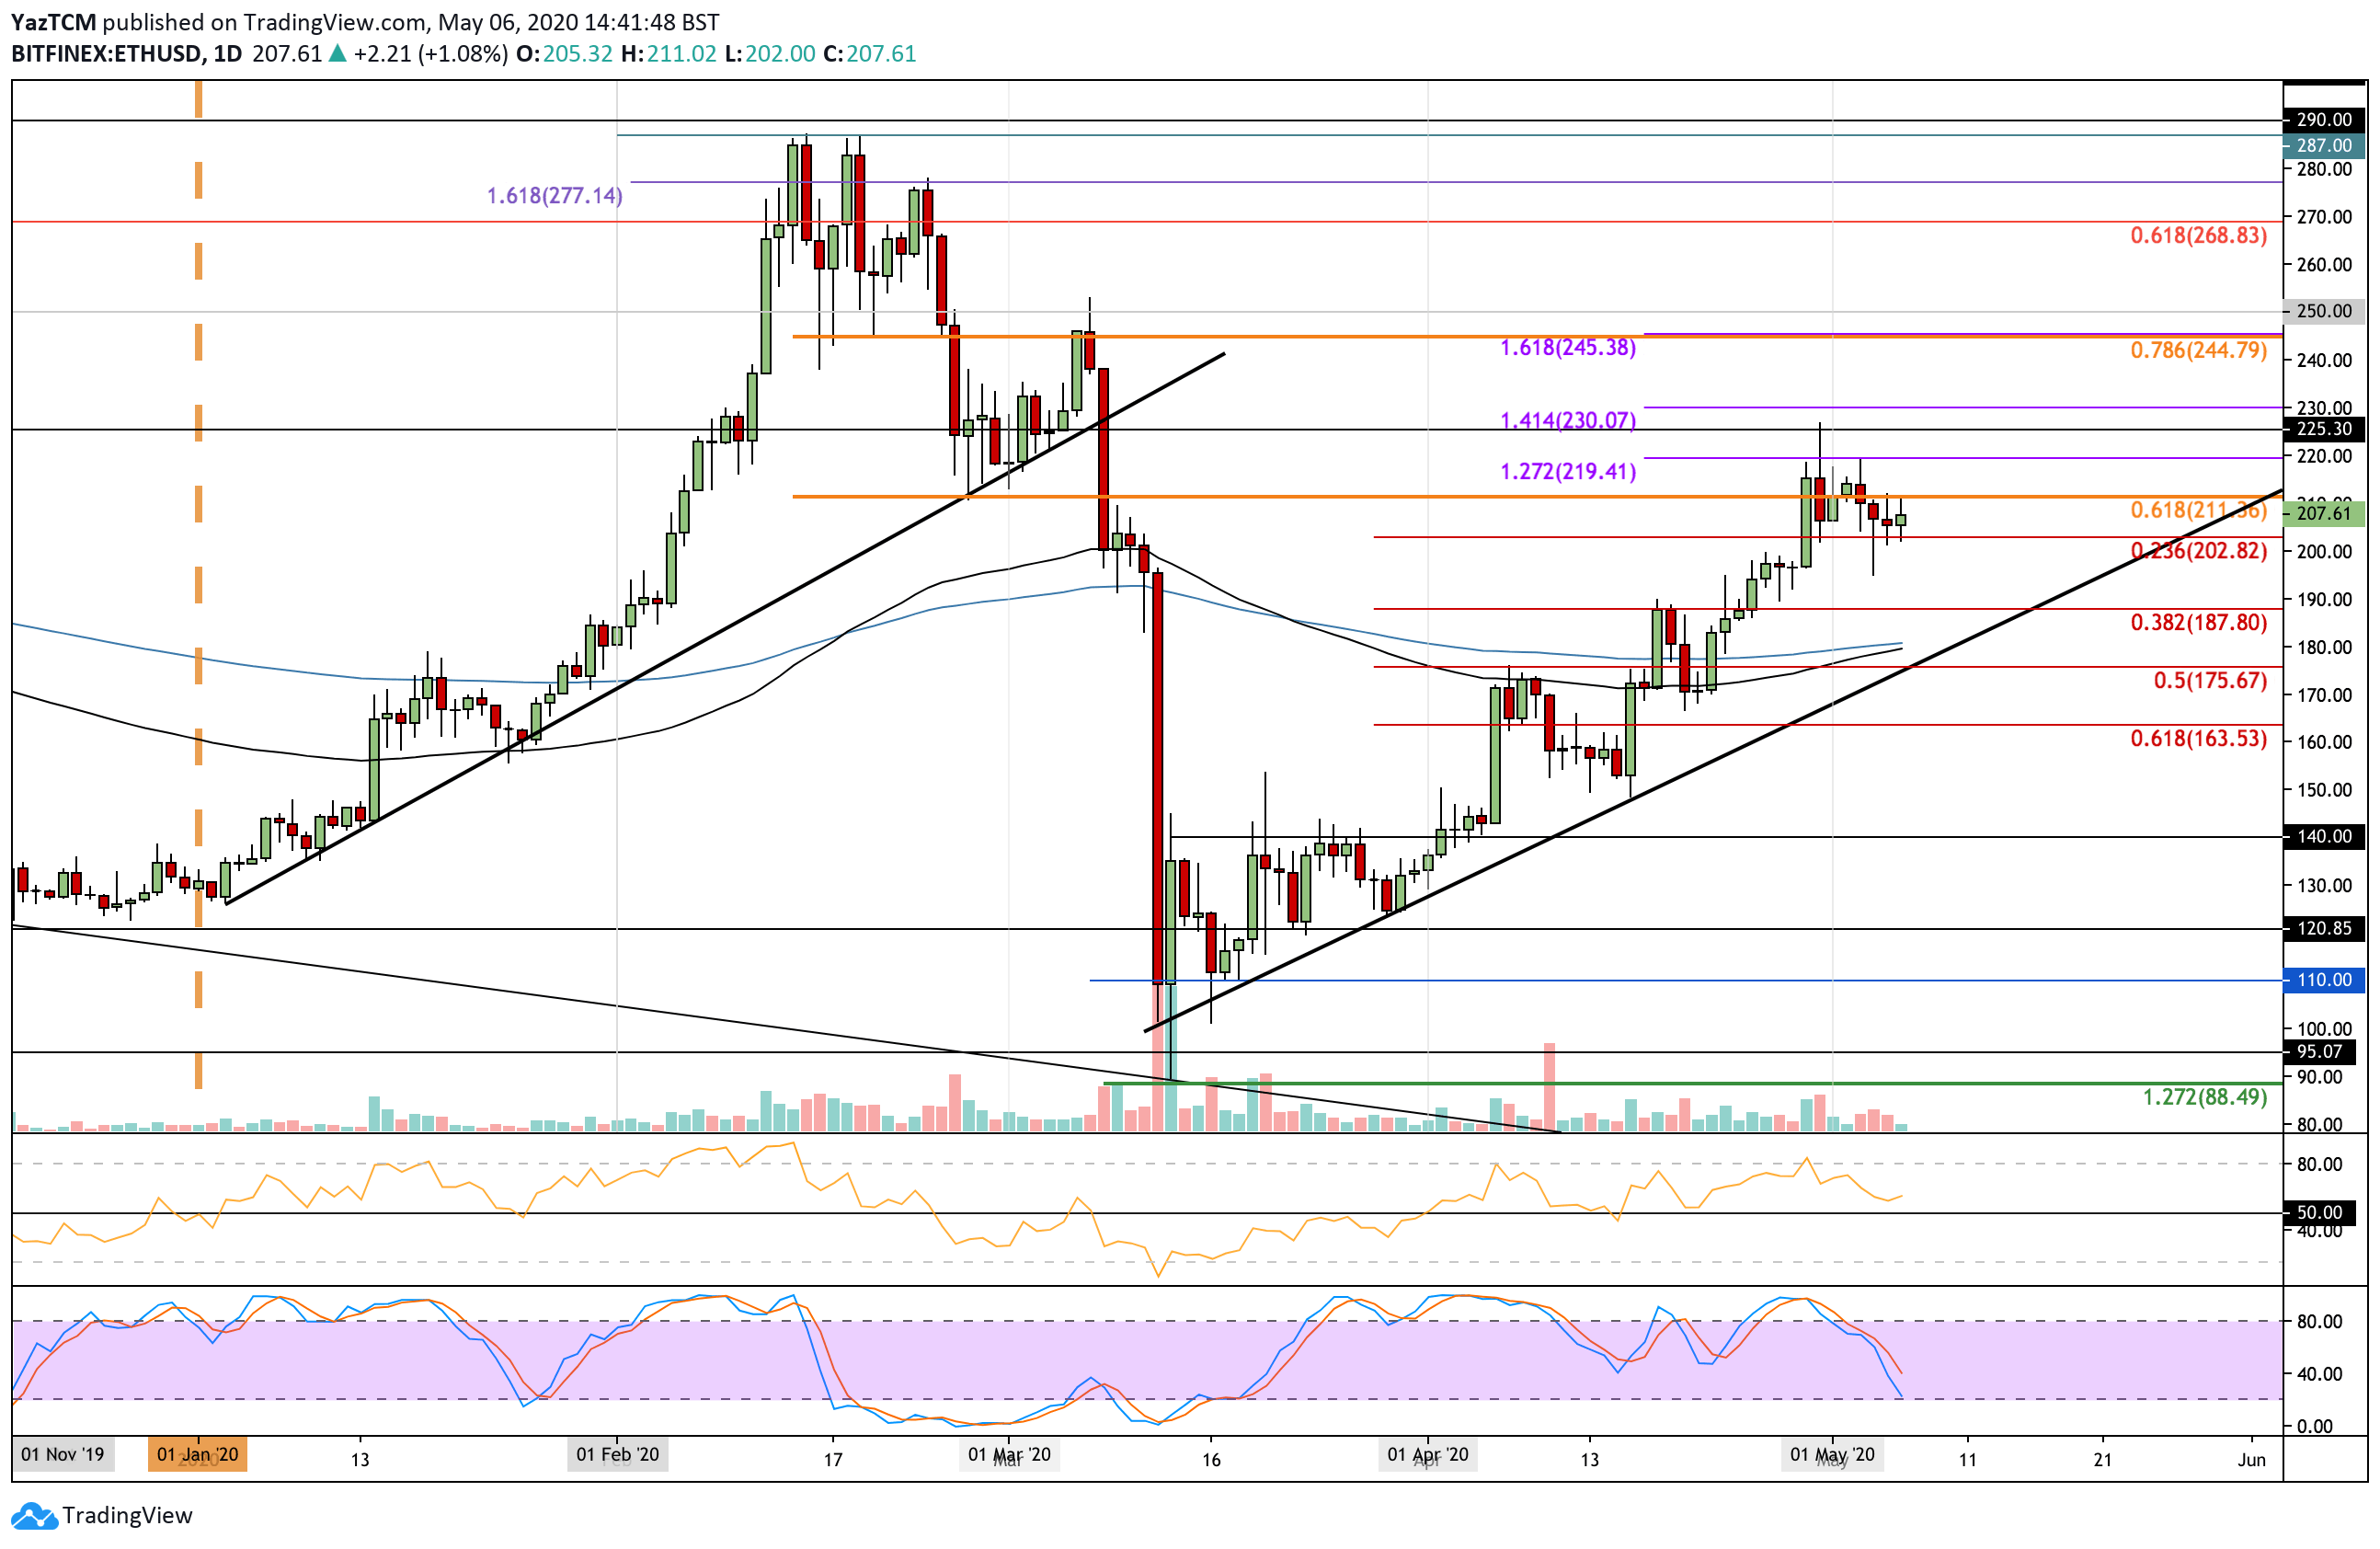
ETH/USD:
Support: $200, $194, $187.
Resistance: $211, $220, $225.
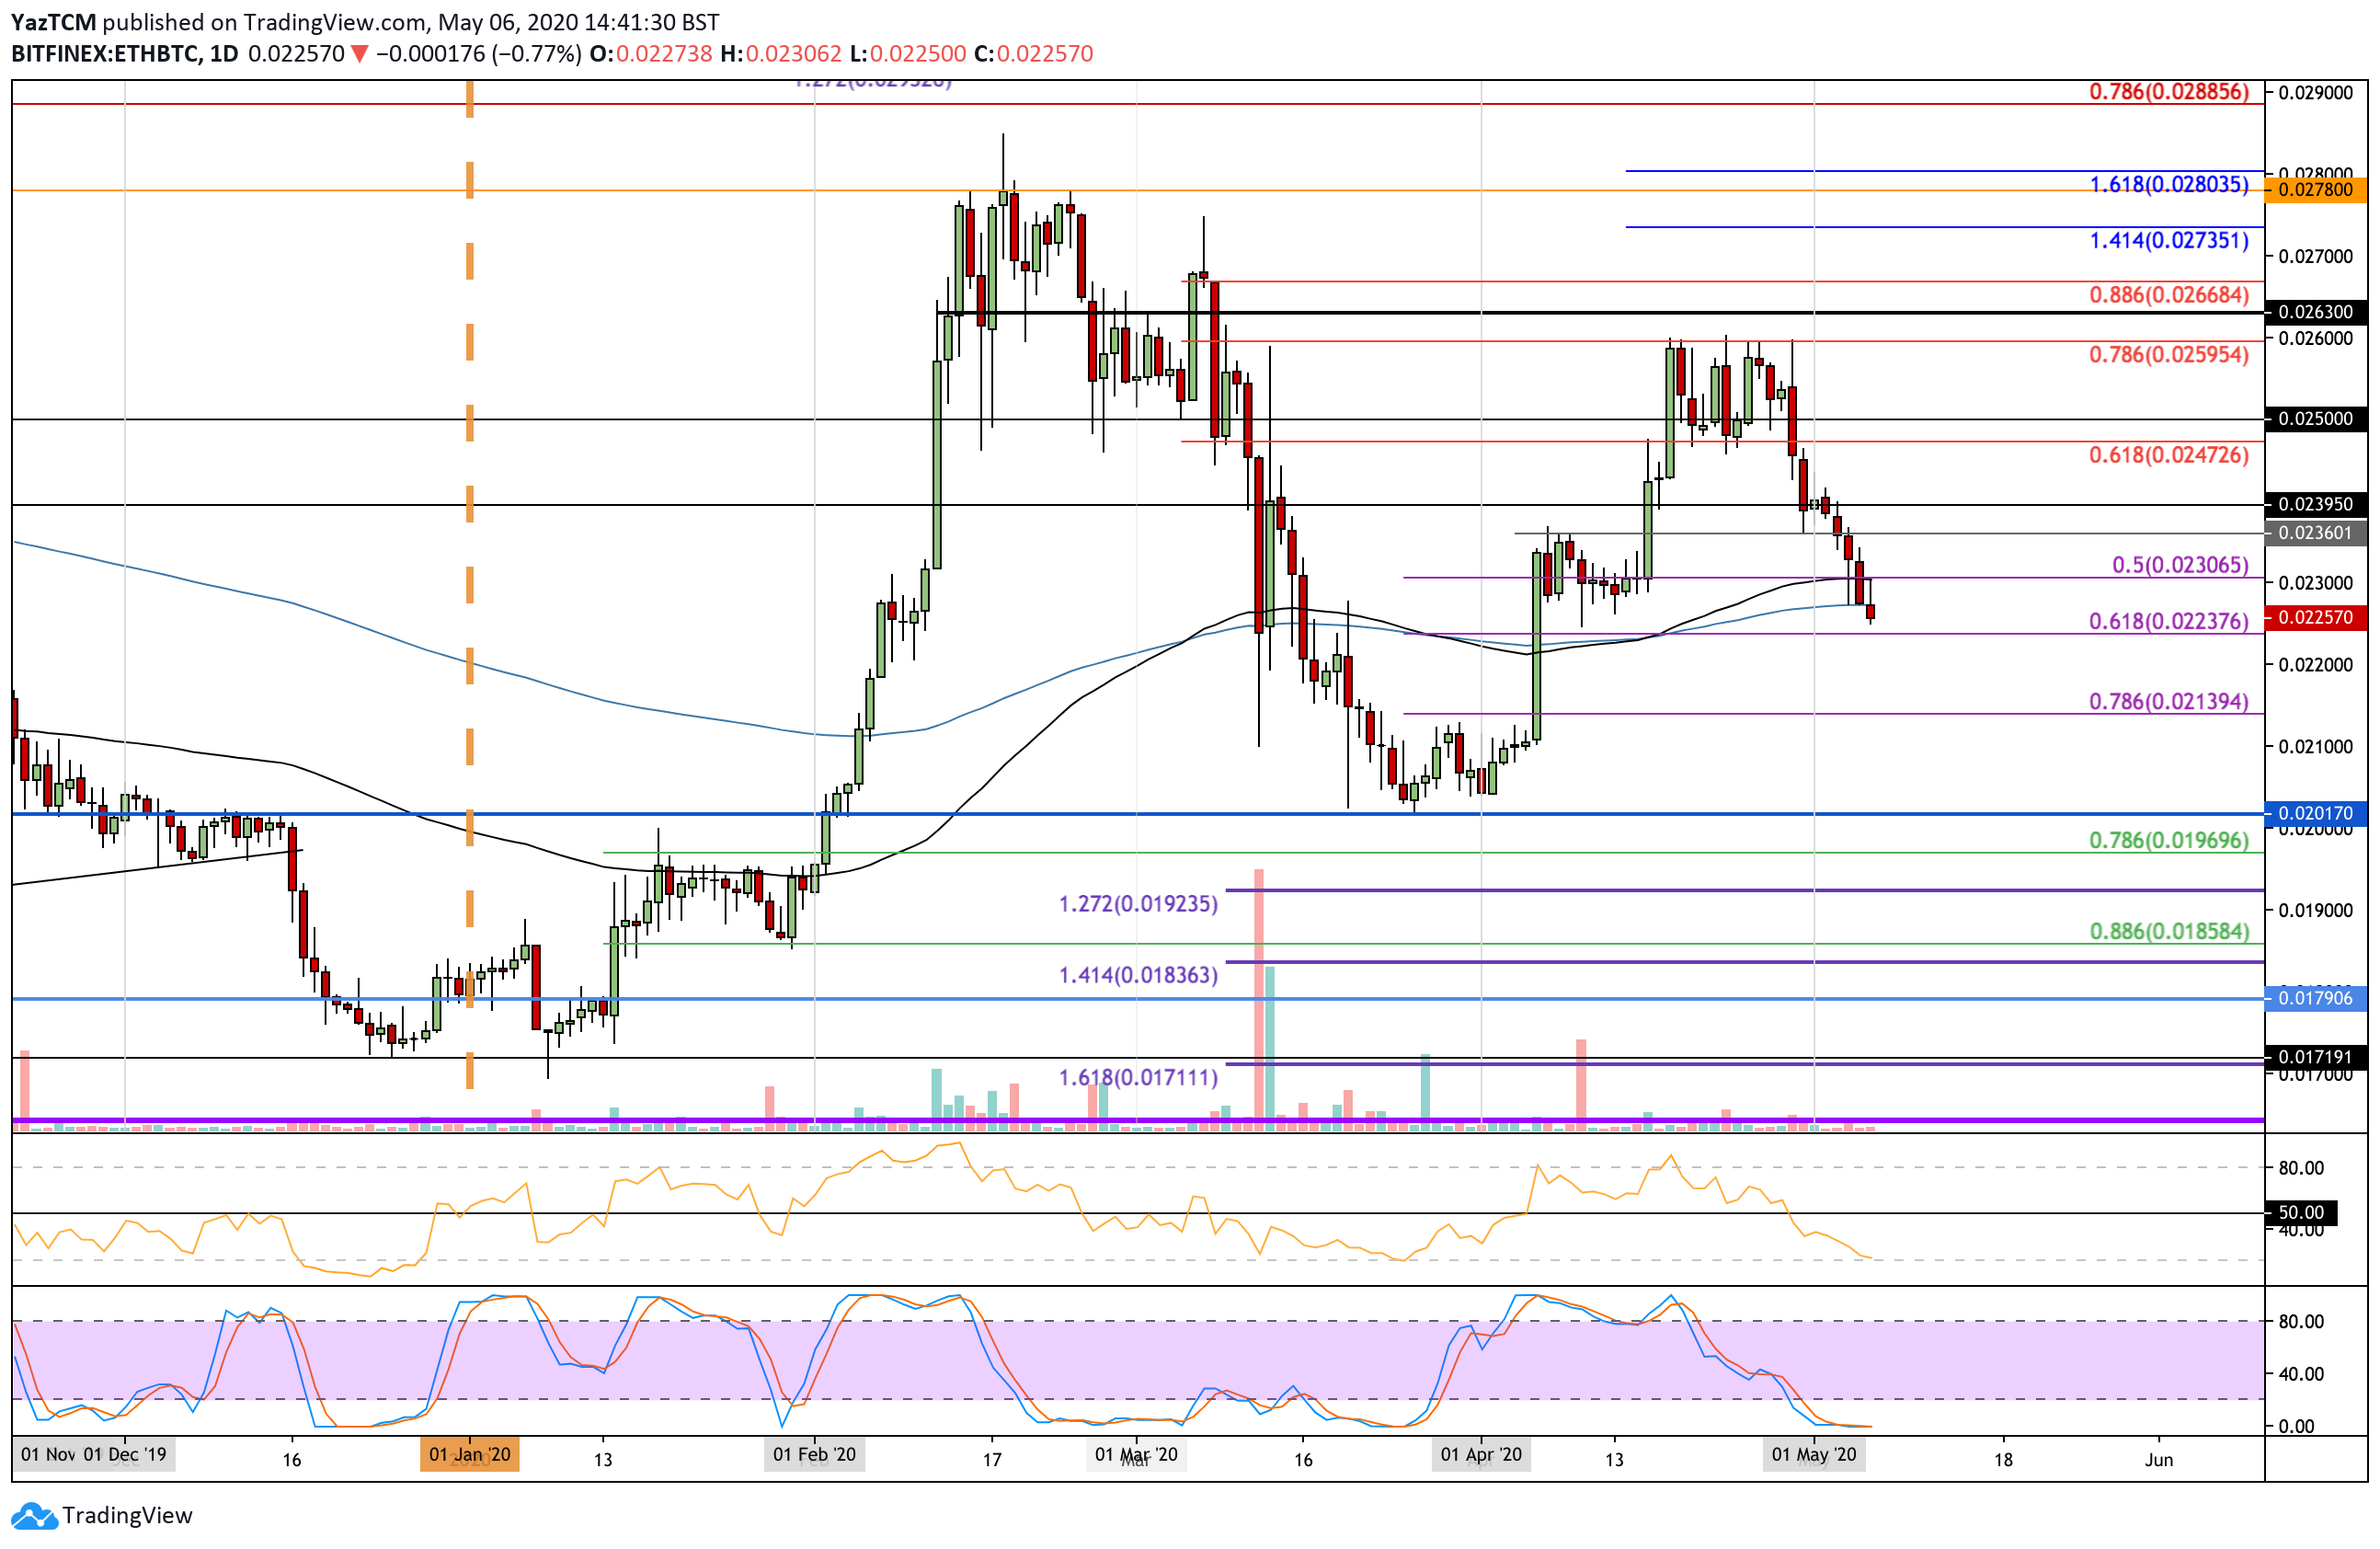
ETH/BTC:
Support: 0.0223 BTC, 0.022 BTC, 0.0213 BTC.
Resistance: 0.0227 BTC, 0.023 BTC, 0.0236 BTC.
Ethereum has been trapped within a range between $215 and $194 during May 2020. It pushed higher today from the $202 level as it reached $208. However, it is important to note that this is not a push from the ETH bulls but rather a result of BTC breaking above $9,000 again.
Nevertheless, ETH is moving upward, but it still has to face the resistance at $220 (1.272 Fib Extension) if it wants to continue.
The first level of resistance lies at $211. Above this, resistance is located at $220 (1.272 Fib Extension), $225, and $230 (1.414 Fib Extension). This is followed by additional resistance at $244 (bearish .786 Fib Retracement).
On the other side, the first level of support lies $202 (.236 Fib Retracement). Beneath $200, added support is found at $194, $187 (.382 Fib Retracement), and $180 (200-days EMA).
The RSI has leveled out above the 50 level as the bulls refuse to give up on their hold of the market momentum.
Ethereum’s struggle against Bitcoin continues as it recently dropped beneath the 200-days EMA at 0.0227 BTC. The coin is now trading at 0.0225 BTC after falling for the past 2-weeks from the 0.026 BTC level and looks to be headed lower.
For Ethereum to really surge against the USD, ETH must reverse this downtrend against BTC at the next support level (0.0223 BTC) to stop the ETH/BTC decline.
If the sellers continue to drive ETH lower, the first level of support lies at 0.0223 BTC (.618 Fib Retracement). Beneath this, support lies at 0.022 BTC, 0.0213 BTC (.786 Fib Retracement), and 0.021 BTC.
On the other side, if the bulls can reverse at 0.0223 BTC, resistance will be located at the 200-days EMA (0.0227 BTC), 0.023 BTC, and 0.0236 BTC.
The RSI has reached oversold conditions and is ready to bounce higher to show the selling momentum is fading. Furthermore, the Stochastic RSI is in oversold conditions as well and is primed for a bullish crossover to push ETH/BTC upward.