Ethereum struggled this past week, marking a decline of 8.7%, which brought its price down to $171.60. The cryptocurrency had been trading above a rising support line but had collapsed beneath it during the week, which caused it to fall to as low as $165. Ethereum has now lost a total of 22% over the past month.
ETH remains the second-largest cryptocurrency with a market cap of $18.63 billion.
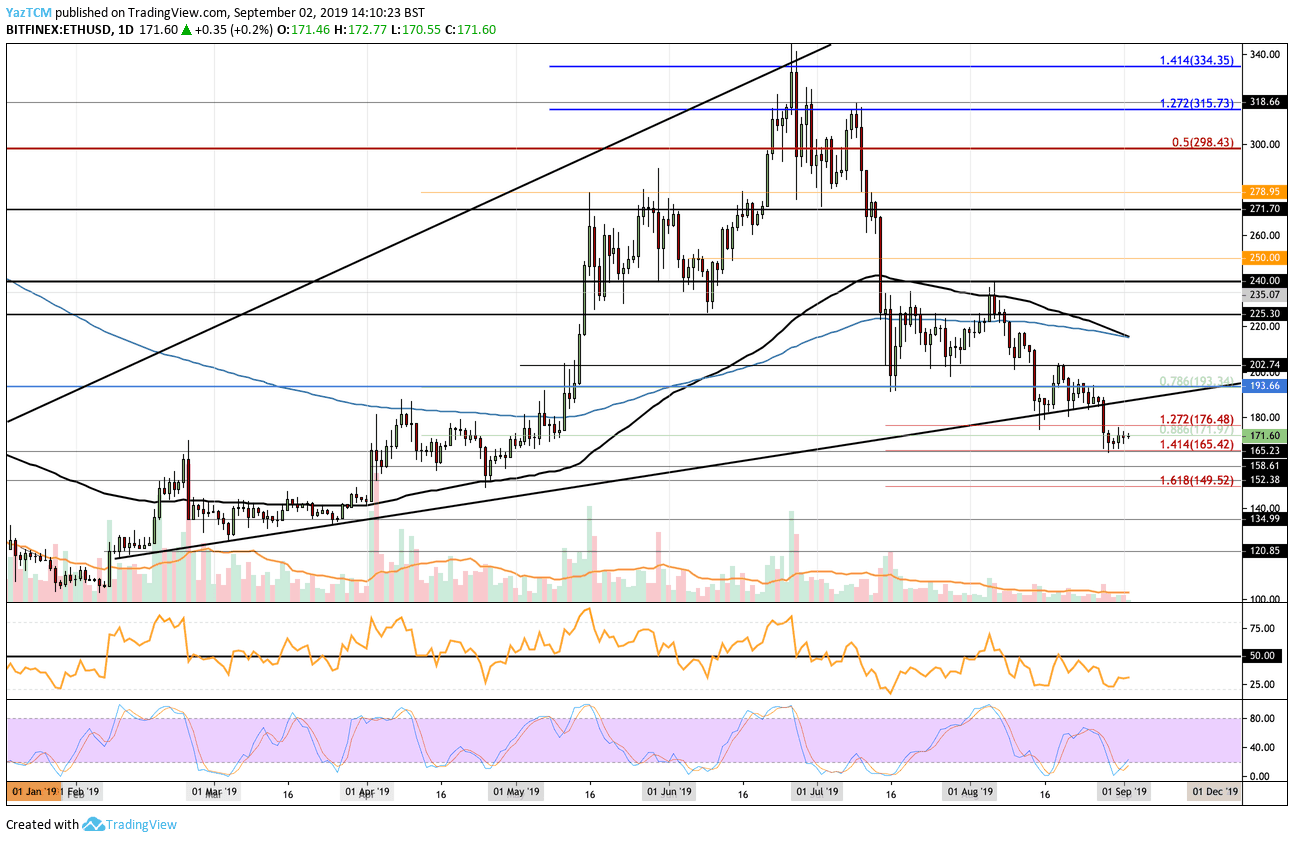
Looking at the ETH/USD 1-day chart:
- Since our previous ETH/USD analysis, ETH dropped beneath the long term rising support trend line. After that, it continued to decline until finding support at $165.42 which was provided by the downside 1.414 Fibonacci Extension level. ETH has rebounded from there and it currently trades at around $171.60.
- From above: The nearest levels of resistance lie at $171.92 (previous .886 Fib Retracement) and $176.48. Higher resistance is located at $180 and then at the previous long term rising support line. Above the trend line, resistance lies at $193, $200, $202, and $218 (100-days and 200-days EMA).
- From below: The nearest level of support lies at $165.42. Beneath this, support lies at $158.61, $152.38, and $149.52 (downside 1.618 Fibonacci Extension level). Beneath $149, support can be expected at $140, $135, and $120.85.
- The trading volume remains very flat and still shows no signs of increasing.
- The RSI has recently bounced from overbought conditions, which shows that the bulls are potentially trying to halt the bearish momentum. Furthermore, the Stochastic RSI has recently produced a bullish crossover signal which could suggest we will be moving higher.
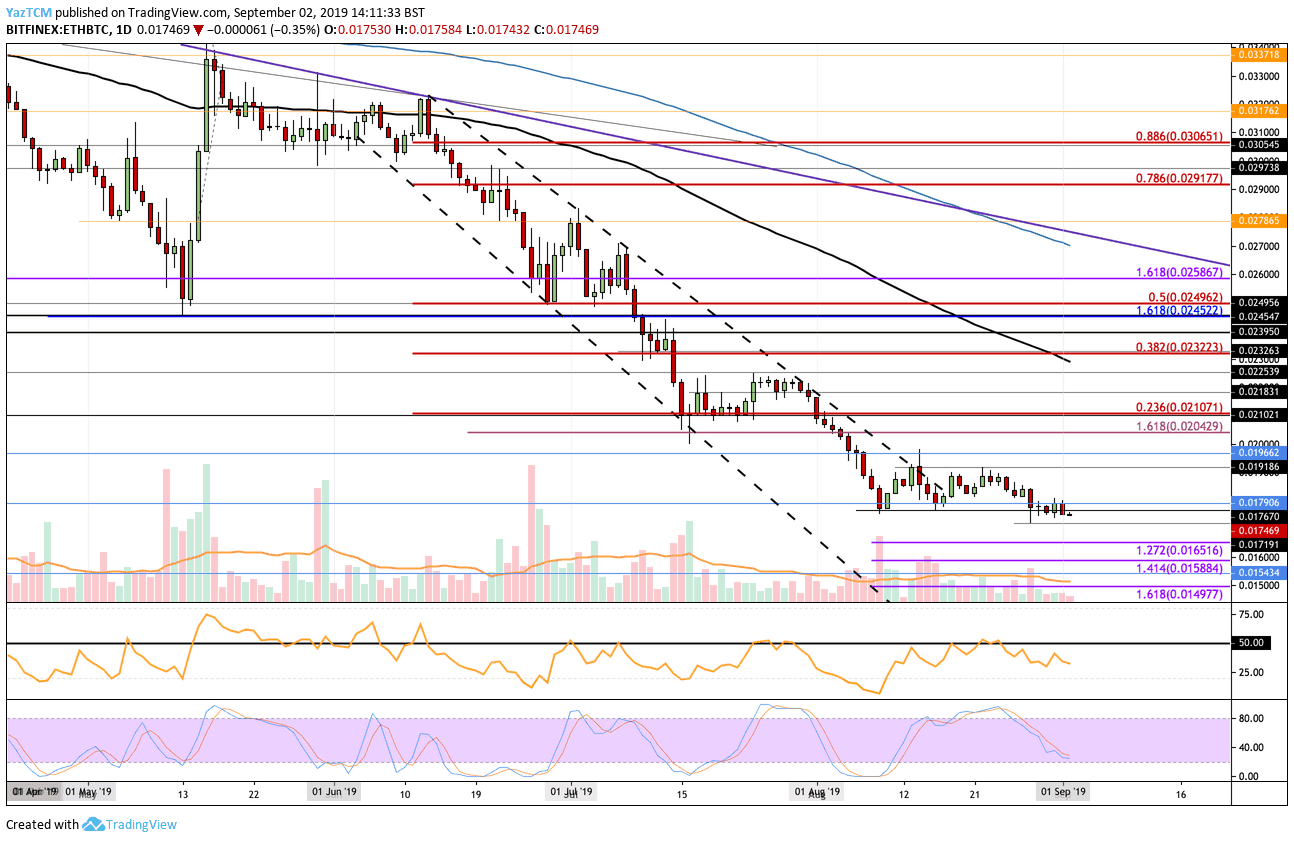
Looking at the ETH/BTC 1-day chart:
- Ethereum continued to trade sideways but is showing signs that it might head lower after falling beneath the support at 0.01760 BTC. ETH is now trading at 0.0174 BTC and looks to be headed even lower.
- From above: The nearest levels of resistance lie at 0.0176 BTC and 0.018 BTC. Above this, higher resistance is found at 0.01918 BTC, 0.019662 BTC, and 0.020 BTC.
- From below: The nearest level of support lies at 0.017191 BTC. Beneath this, support lies at 0.017 BTC, 0.165 BTC, and 0.015884 BTC (downside 1.272 and 1.414 Fib Extensions). Following this, support lies at 0.0154 BTC and 0.014977 BTC.
- The trading volume remains super low, far beneath the average level.
- The RSI has recently turned away from the 50 level which could suggest the bears are starting to gain momentum.
SPECIAL OFFER (Sponsored)
Binance Free $600 (CryptoPotato Exclusive): Use this link to register new account and receive $600 exclusive welcome offer on Binance (
full details).
LIMITED OFFER 2024 for CryptoPotato readers at Bybit: Use this link to register and open a $500 BTC-USDT position on Bybit Exchange for free!
Disclaimer: Information found on CryptoPotato is those of writers quoted. It does not represent the opinions of CryptoPotato on whether to buy, sell, or hold any investments. You are advised to conduct your own research before making any investment decisions. Use provided information at your own risk. See Disclaimer for more information.
Cryptocurrency charts by TradingView.