Ethereum has seen a small drop in price over the past 24 hours of around 2.4%. This has brought the current price to the $262 level as Ethereum continues to break the resistance around the $271 – $279 level.
Despite the recent decline, Ethereum has increased by 62% over the past 30 days and a Golden Crossover had also occurred during May 2019 when the 50 days EMA crossed above the 200 days EMA.
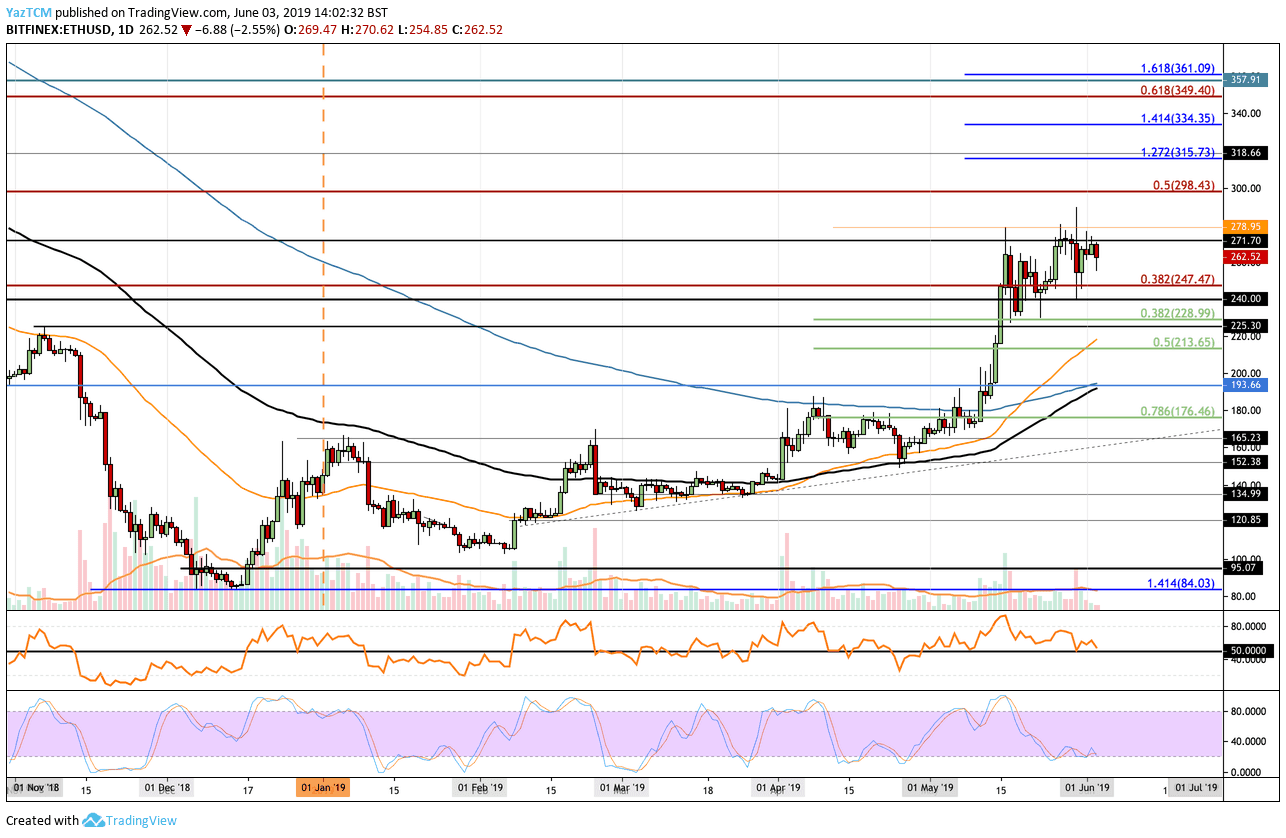
Looking at the ETH/USD 1-Day Chart:
- Since our previous ETH/USD analysis, we can see that Ethereum failed to continue to close above the resistance around the $272 level. Ethereum has since turned away and is now currently trading at the $262 support level.
- From above: The nearest levels of resistance now lies between $271 and $280. If the bulls can close above $280, higher resistance is then located between $298 – $300. The resistance at $298 is further strengthened by a bearish .5 Fibonacci Retracement level (marked in red). Above $300, further resistance lies at $315, $334 and $350.
- From below; the nearest level of strong support now lies between $250 – $247. Beneath this, further support lies at $240, $228, $213, $200 and $193.
- The trading volume has started this month off at a below average rate.
- The Stochastic RSI has reached overbought conditions as we wait for a bullish crossover to signal a move higher. Furthermore, the RSI has approached the 50 level to indicate indecision within the market at this moment in time.
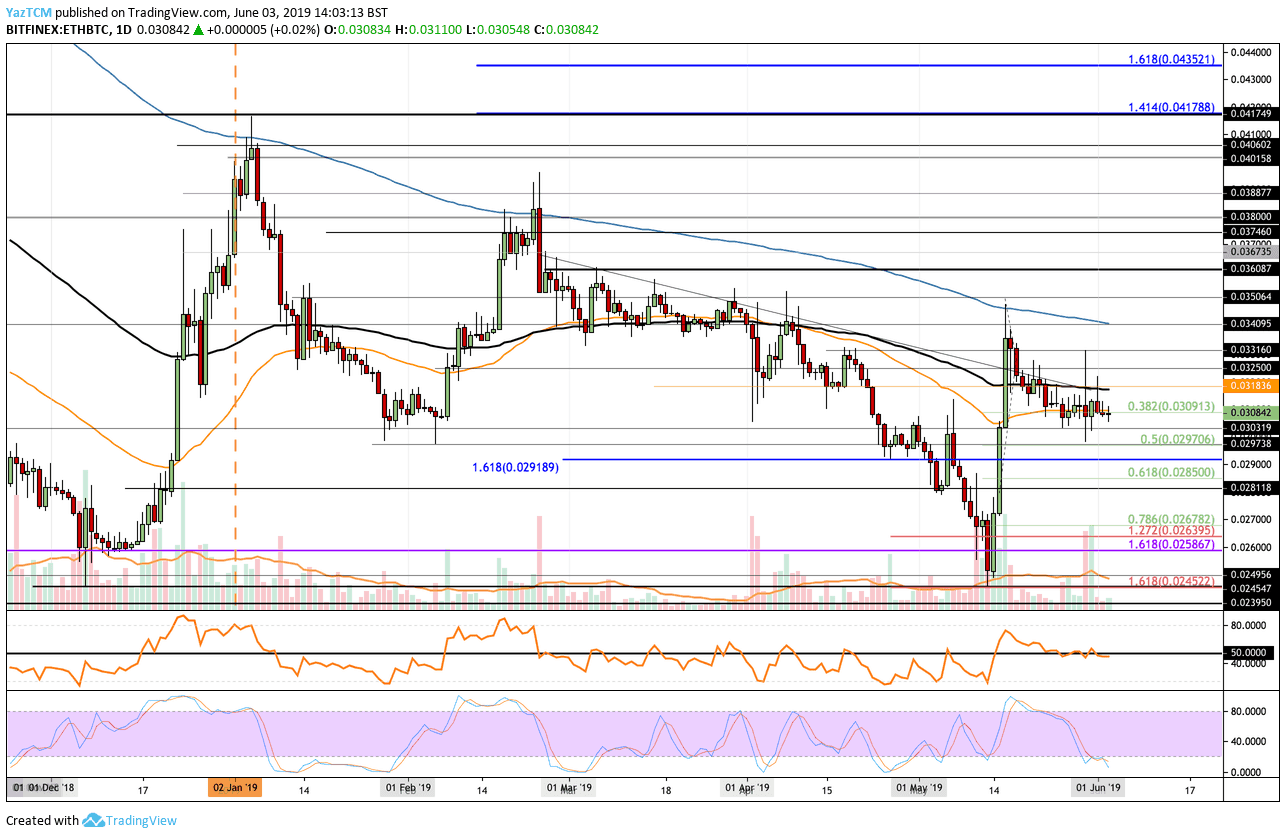
Looking at the ETH/BTC 1-Day Chart:
- Against Bitcoin, Ethereum has done well to hold the support at the 0.0309 BTC level. The coin is trading beneath the 100 day EMA but has found some stability around the 0.03 BTC area.
- From above: The nearest level of resistance lies at 0.031 BTC and 0.03181 BTC. Above this, further resistance lies at 0.0325 BTC, 0.0331 BTC and 0.034 BTC (which also contains the 200 days EMA).
- From below: The nearest level of support lies at 0.030 BTC. Beneath this, further support lies at 0.0298 BTC, 0.02918 BTC, and 0.0285 BTC.
- The Stochastic RSI has also reached extreme overbought conditions as we wait for a bullish crossover signal above.
SPECIAL OFFER (Sponsored)
LIMITED OFFER 2024 for CryptoPotato readers at Bybit: Use this link to register and open a $500 BTC-USDT position on Bybit Exchange for free!
Disclaimer: Information found on CryptoPotato is those of writers quoted. It does not represent the opinions of CryptoPotato on whether to buy, sell, or hold any investments. You are advised to conduct your own research before making any investment decisions. Use provided information at your own risk. See Disclaimer for more information.
Cryptocurrency charts by TradingView.