ETH/USD:
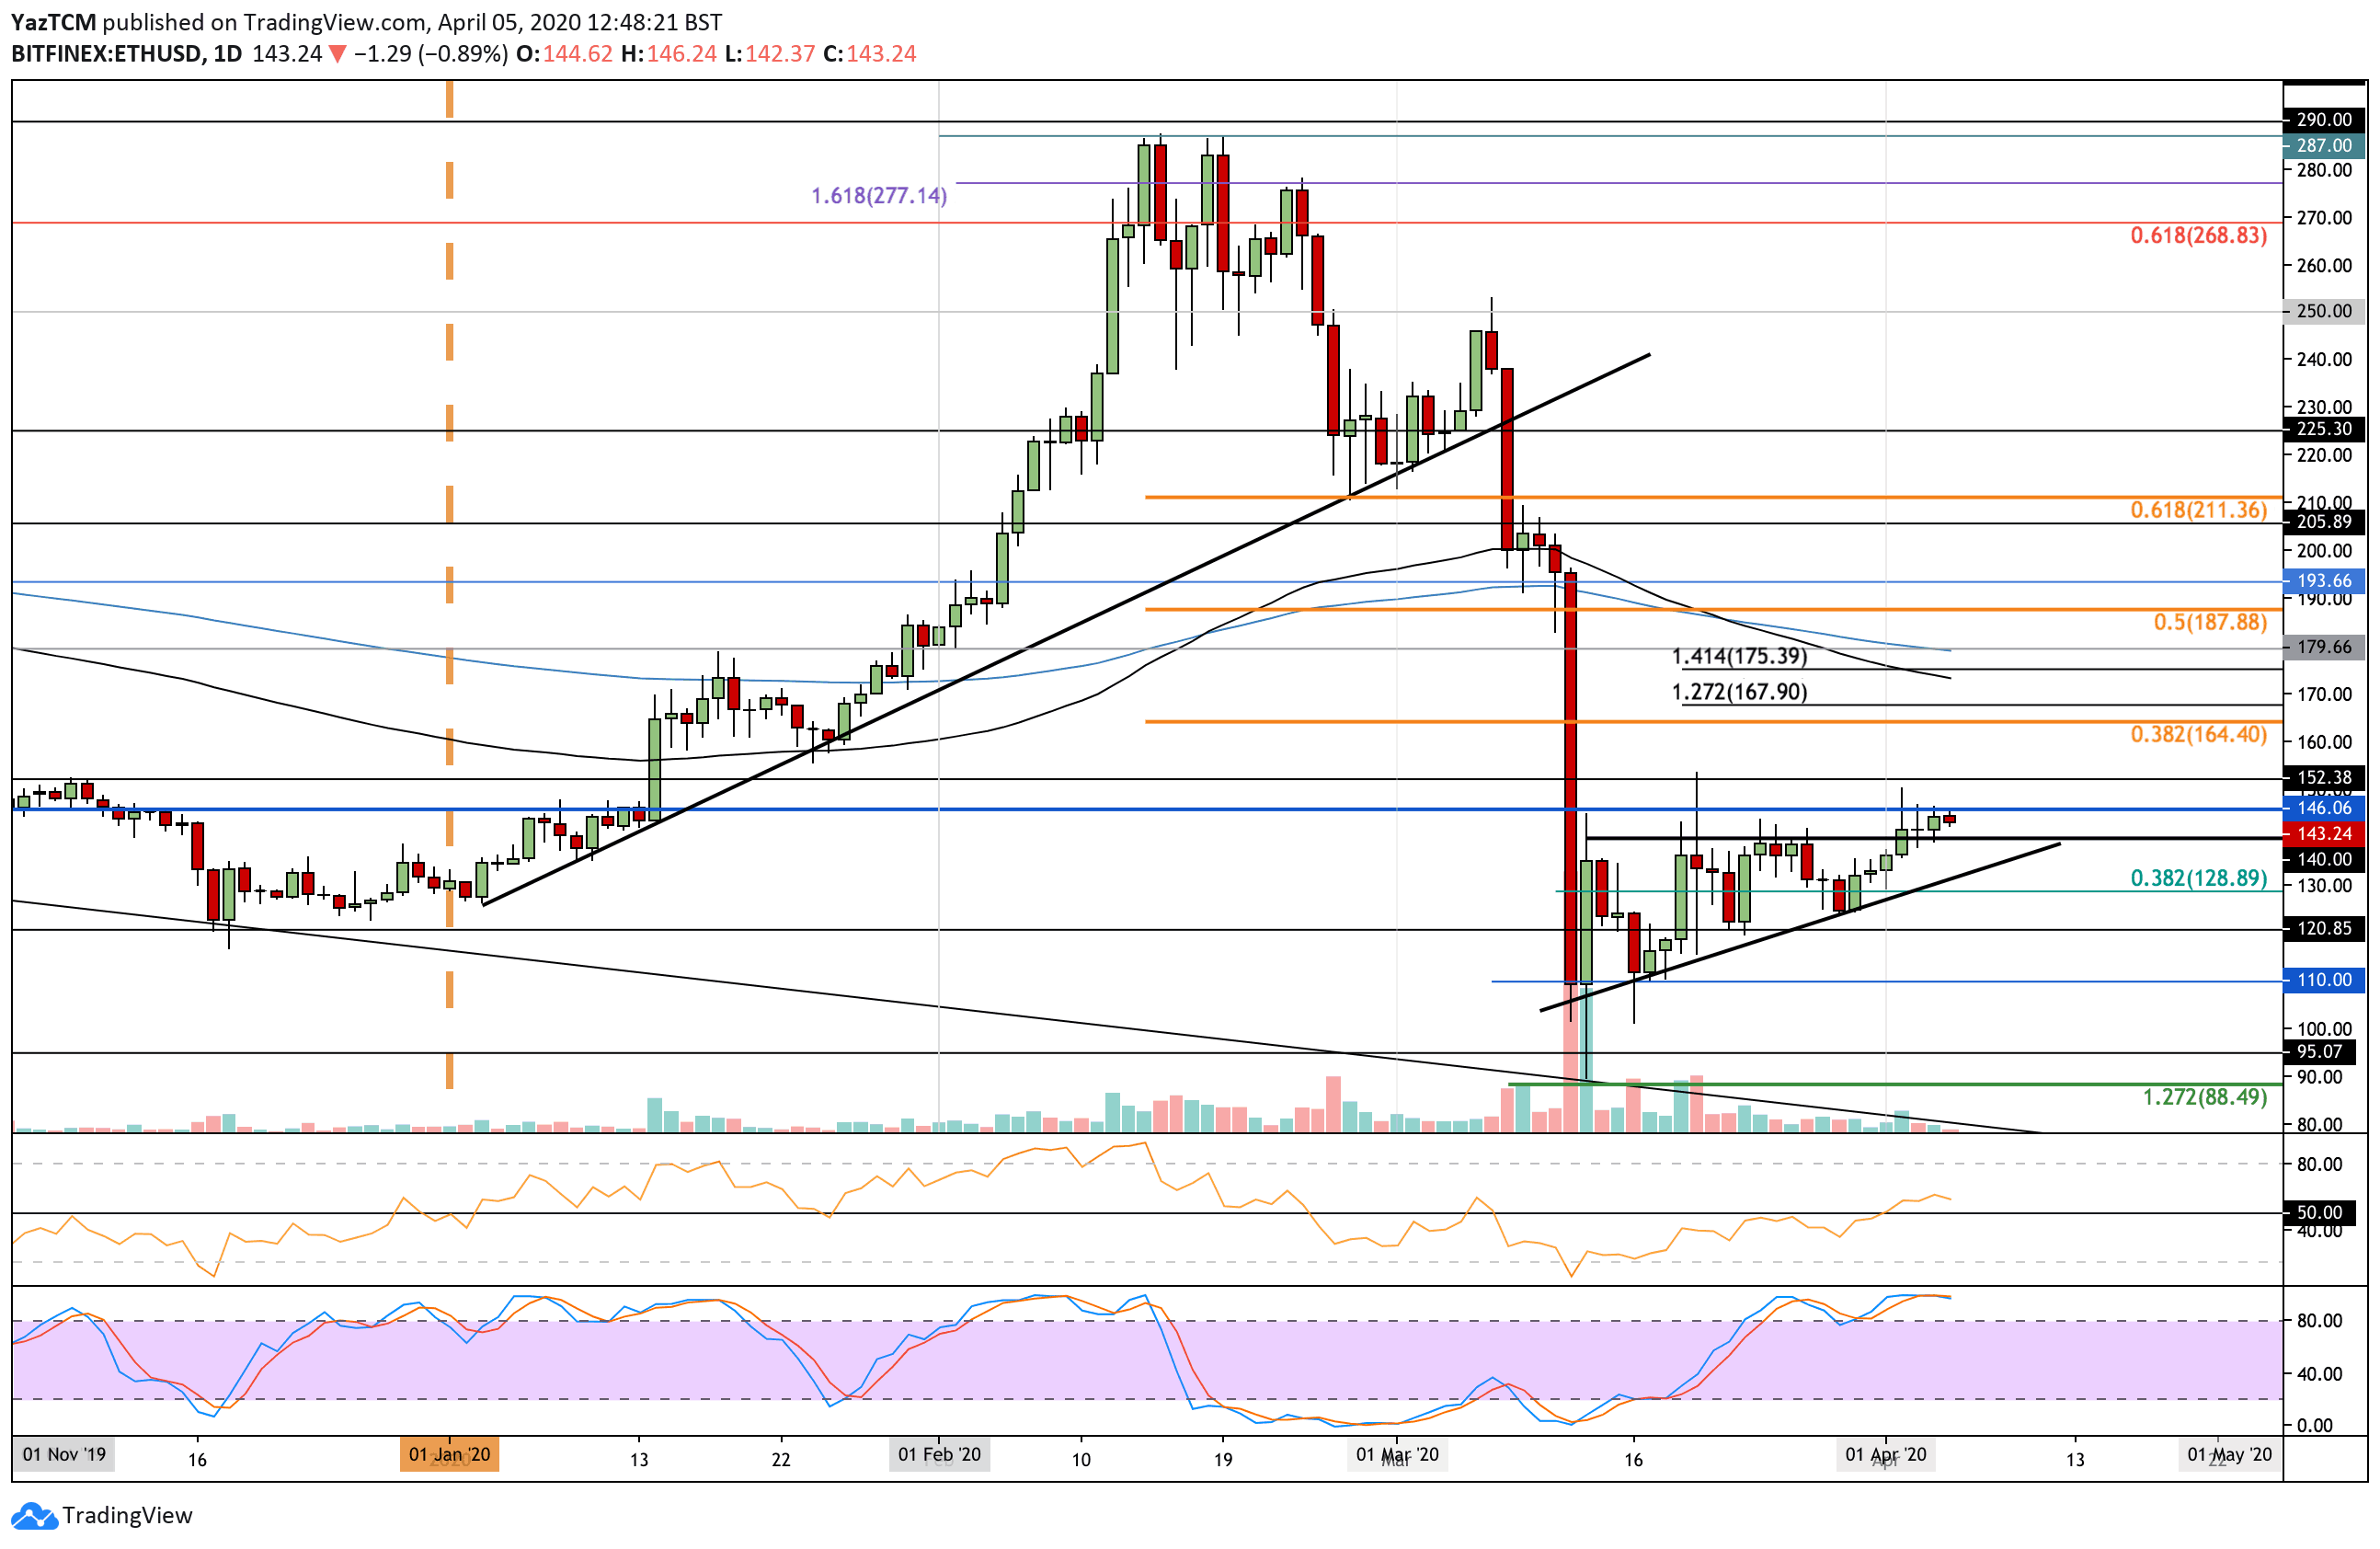
Support: $140, $129, $120.
Resistance: $146, $165, $170.
ETH/BTC:
Support: 0.021 BTC, 0.0201 BTC, 0.0196 BTC.
Resistance: 0.0215 BTC, 0.0222 BTC, 0.023 BTC.
Ethereum managed to break the upper boundary of the triangle pattern at the start of April as the cryptocurrency increased above $140. It had previously been trapped by this resistance for the last 2-weeks of March.
ETH is now struggling with higher resistance at $146 and must break above this to kick off a strong bullish run higher toward $165. However, it does look like it is about to be starting to roll over.
If ETH breaks $146 and $150, strong resistance is located at $165, which is provided by a bearish .382 Fib Retracement. Above this, resistance lies at $170 (100-days EMA) and $180 (200-days EMA).
On the other side, the first level of support lies at $140. Beneath this, support is found at the rising support line, $129 (.382 Fib Retracement), $120, and $110.
The RSI broke 50 as the bulls take control of the market momentum. However, it is starting to point downward, which suggests weak bullish momentum. If the RSI can remain above 50 during this retracement and rebound, then it will be free to head toward $165.
Against Bitcoin, Ethereum has been on the rise this month as the coin reaches 0.0211 BTC. It has been trapped in a range between 0.0212 BTC and 0.0201 BTC for the past 13-days of trading.
Ethereum needs to break above resistance at 0.0225 BTC for it to start to turn bullish throughout the next few weeks.
Above 0.0212 BTC, resistance lies at 0.0215 BTC and 0.022 BTC (100-days & 200-days EMAs). Above this, resistance stands at 0.0225 BTC and 0.023 BTC (bearish .382 Fib Retracement).
Toward the downside, support lies at 0.021 BTC, 0.0201 BTC, and 0.0196 BTC (.786 Fib Retrecaement).
The buyers are attempting to break the 50 level as they try to take control of the market momentum. However, the Stochastic RSI is already oversold, and a bearish crossover signal would send it lower.