The price of Ethereum has been pretty stable over the past week, increasing by 1% to $187.57. It found support at a long-term rising trend line and has remained above it since mid-August. If the bulls can hold this support, we may see a rebound.
Ethereum remains the second-largest cryptocurrency by market value, with a market cap of $20.17 billion.
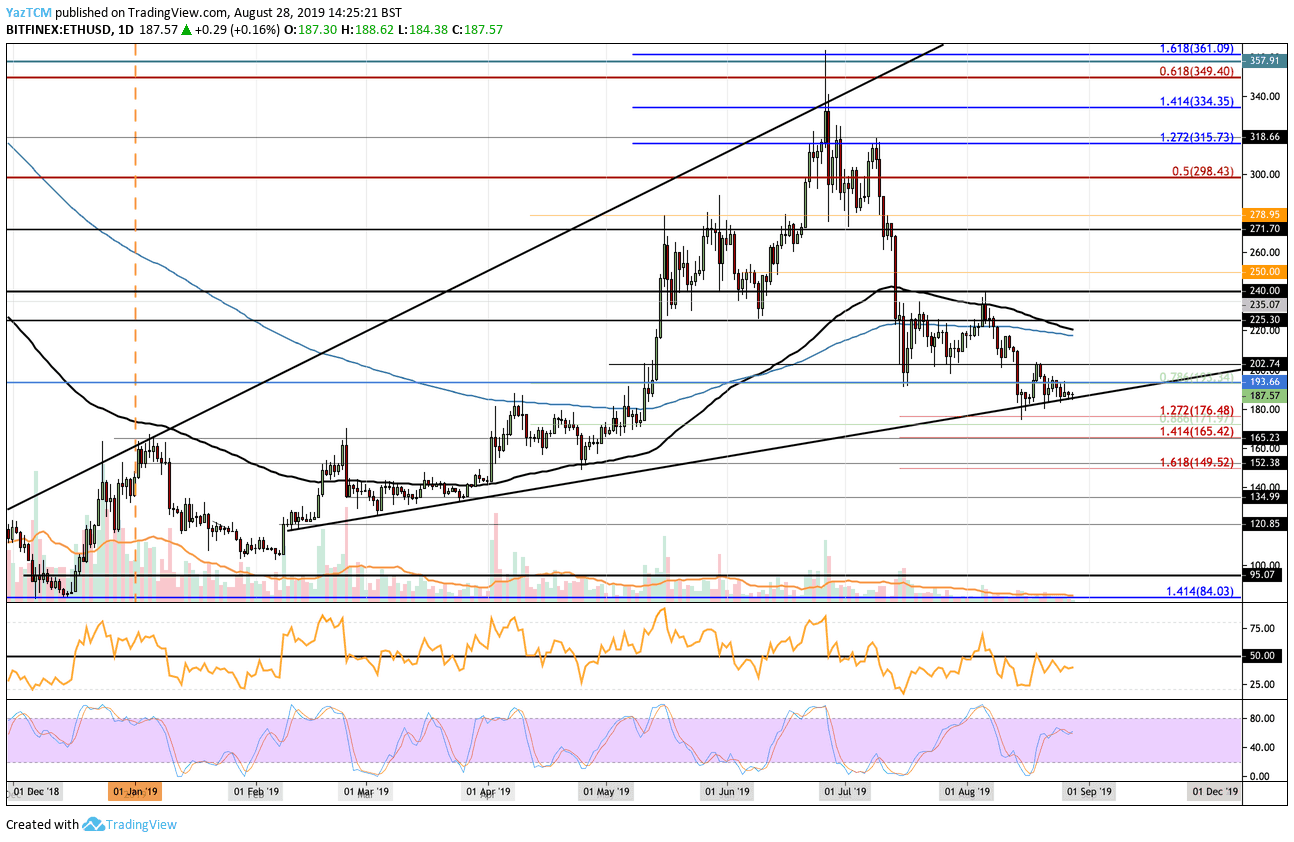
Looking at the ETH/USD 1-day chart:
- Since our previous ETH/USD analysis, ETH has continued to trade along the contour of the rising support line dating back to February.
- From above: The nearest levels of resistance lie at $193 and $202. Higher resistance lies at $217 and $220, which contain the 100- and 200-day EMA and will therefore require significant momentum to overcome. Beyond $220, resistance lies at $225, $240 and $250.
- From below: If the price breaks beneath the rising support line, immediate support lies at $176 (downside 1.272 Fib extension), $171, and $165 (downside 1.414 Fib extension). Beneath $165 lies support at $160 and $150.
- The trading volume is starting to pick up, though it remains around average.
- The RSI has remained beneath 50 but is grinding higher, which suggests that sellers might be losing some strength. If the RSI rises above 50, a rebound at the rising support line is likely to occur.
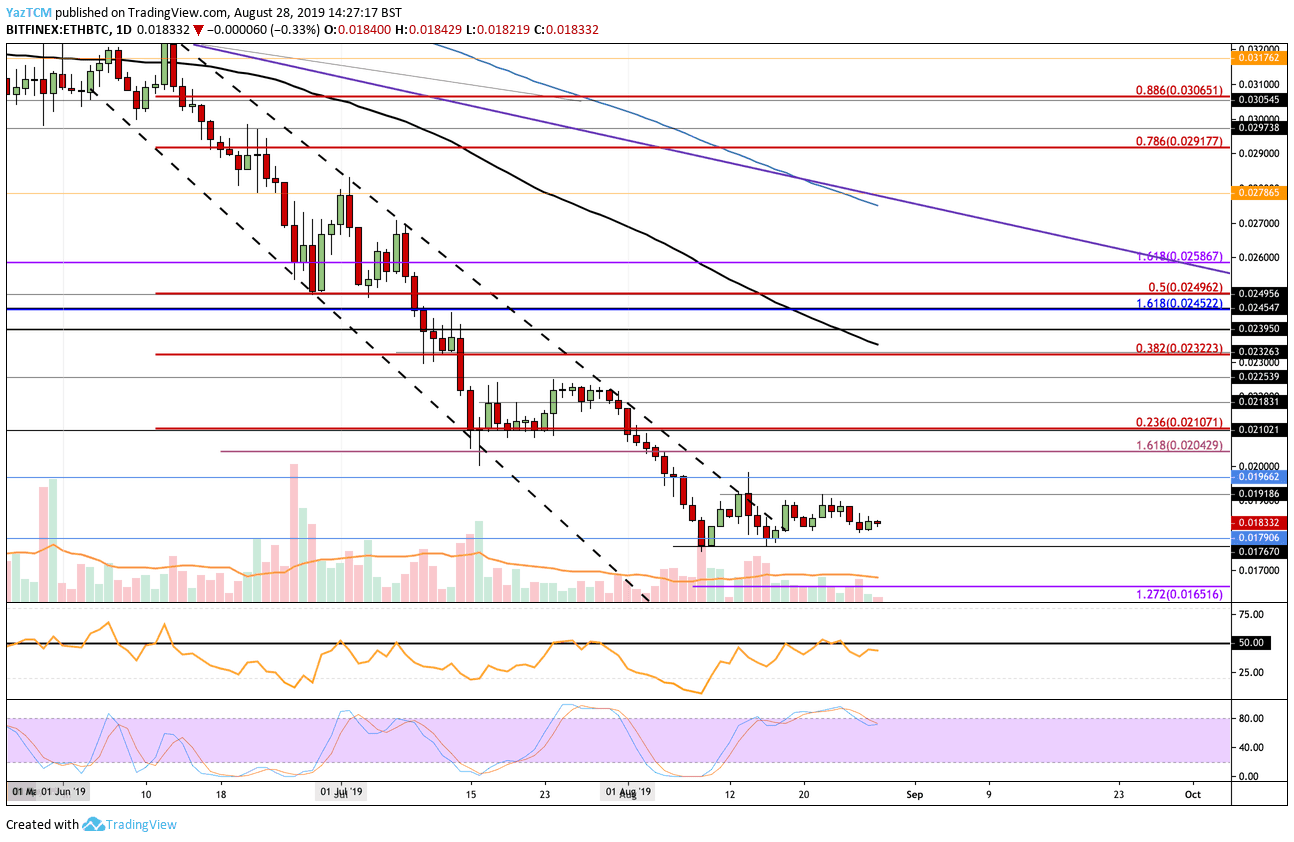
Looking at the ETH/BTC 1-day chart:
- Ethereum has continued to trade sideways after breaking out of the previous 2-month-old falling price channel. ETH has been trading between 0.01918 BTC and 0.01767 BTC.
- From above: The nearest level of resistance lies at the upper boundary of the range at 0.01918 BTC. Higher resistance is found at 0.01966 BTC, 0.02 BTC, 0.0204 BTC, and 0.021 BTC.
- From below: The nearest level of support lies at 0.01790 BTC. Lower support can be found at 0.0176 BTC, 0.017 BTC, and 0.0165 BTC.
- The trading volume remains very low and below average.
- The RSI is very close to 50, indicating market indecision, hence the trading range. For a recovery to occur, we will need to see the RSI break well above 50 to show that the bulls are in control.
SPECIAL OFFER (Sponsored)
Binance Free $600 (CryptoPotato Exclusive): Use this link to register new account and receive $600 exclusive welcome offer on Binance (
full details).
LIMITED OFFER 2024 for CryptoPotato readers at Bybit: Use this link to register and open a $500 BTC-USDT position on Bybit Exchange for free!
Disclaimer: Information found on CryptoPotato is those of writers quoted. It does not represent the opinions of CryptoPotato on whether to buy, sell, or hold any investments. You are advised to conduct your own research before making any investment decisions. Use provided information at your own risk. See Disclaimer for more information.
Cryptocurrency charts by TradingView.