Over the past few days, Ethereum has continued to climb higher and has now reached the May 2019 resistance area between $271 – $279. This area had caused ETH to retrace as the bulls struggled to break above it during May 2019. Ethereum has now increased by a total of 13% over the past 7 days – but some of the technical indicators suggest that the current resistance still may be too strong for ETH.
Ethereum remains the second largest cryptocurrency with a current market cap of around $29.12 billion. The coin has been on an incredible bull run over the past 3 months, increasing by a total of 94%.
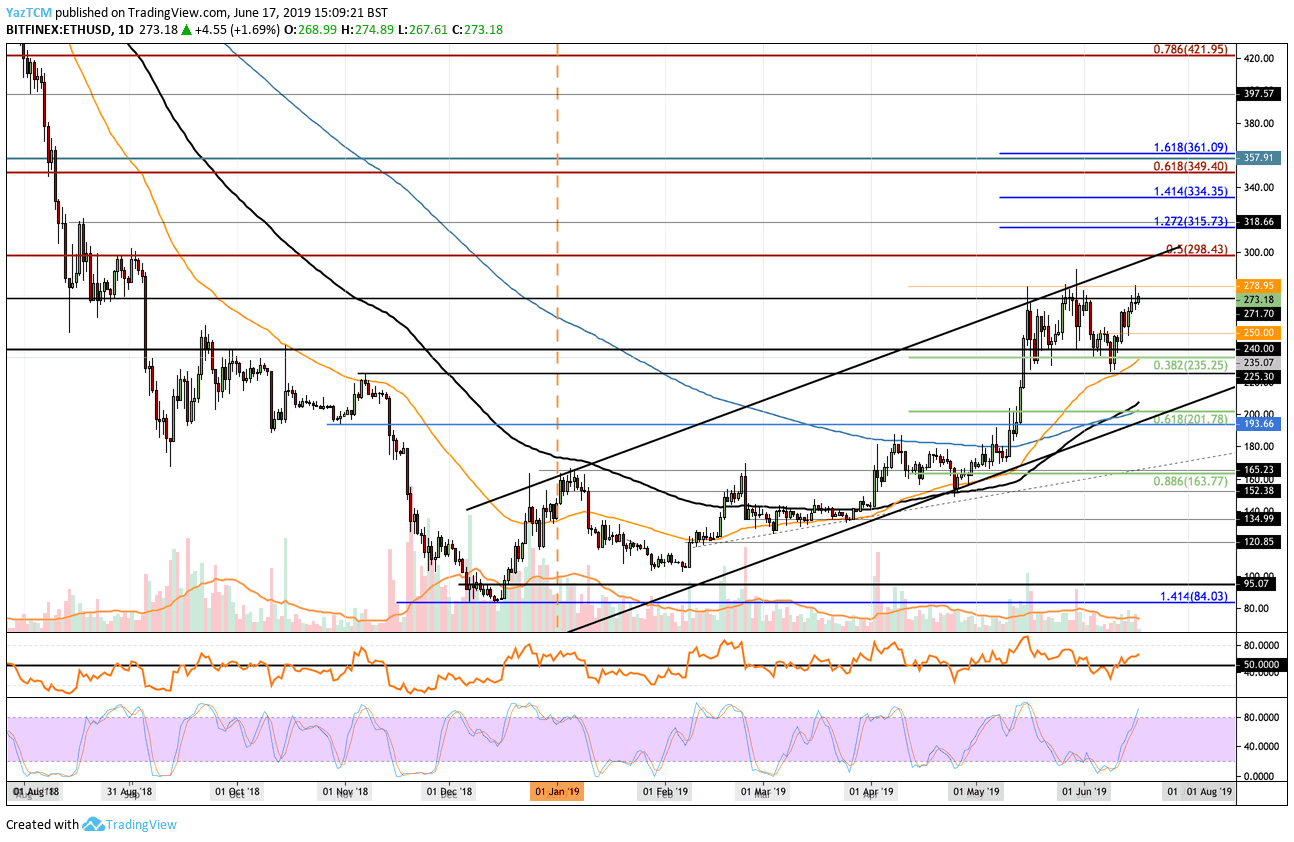
Looking at the ETH/USD 1-Day Chart:
- Since our previous ETH/USD analysis, we can see that ETH/USD continued to climb higher from the $250 support level but has now reached the aforementioned resistance area around $271 – $279. We can see that the cryptocurrency spiked higher toward the $279 level in yesterday’s trading, however, the price was unable to break above this level.
- From above, if the bulls can break above the upper boundary of the resistance range at $279 – and above $280 – the next levels of resistance lie at $290 and $300. The resistance at $300 is bolstered by a long term bearish .5 Fib Retracement at $298.50 and by a long term ascending resistance trend line which also converges in this area. Above $300, further resistance lies at $315, $334 and $350. If the bulls continue further, higher resistance lies at $361, $380, $400 and $421.
- From below: The nearest level of support now lies at $260 and $250. Beneath $250, further support lies at $240, $235, $224, $210, and $200.
- The trading volume has managed to remain pretty high, slightly above the average.
- The Stochastic RSI is quickly reaching overbought conditions which may suggest that ETHUSD will not break the $279 resistance level on this test as the market may be starting to become overstretched.
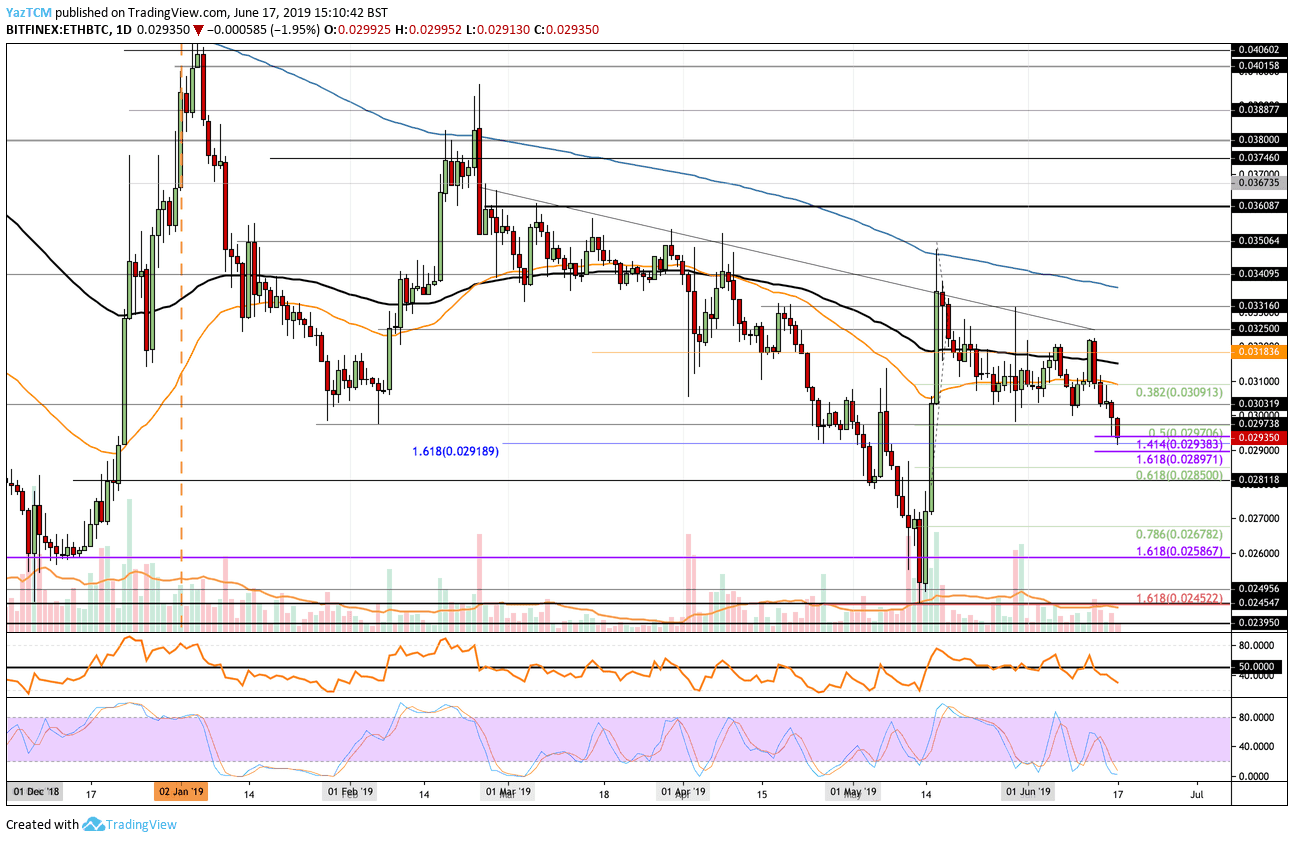
Looking at the ETH/BTC 1-Day Chart:
- Against Bitcoin, we can see that ETHBTC has fallen further from the support at 0.03 BTC. We can see that ETHBTC continued to fall until rebounding from the support at 0.02920 BTC to reach its current point at around 0.02935 BTC.
- From above: The nearest level of resistance lies at 0.02970 BTC and 0.03 BTC. If the bulls climb above 0.03 BTC, higher resistance is found at 0.030 BTC and 0.031 BTC. Above 0.031 BTC, further resistance can be located at 0.0318 BTC 0.032 BTC, and 0.0325 BTC.
- From below: The nearest level of support now lies at 0.02920 BTC. Beneath this, support is found at 0.02897 BTC, 0.0285 BTC, 0.028 BTC, and 0.027 BTC.
- The trading volume is pretty lackluster as it remains below average for June 2019.
- The RSI has recently broken beneath the 50 level to indicate that the sellers have taken control of the market momentum. The Stochastic RSI sits in oversold territory as we wait for a bullish crossover signal above.
SPECIAL OFFER (Sponsored)
LIMITED OFFER 2024 for CryptoPotato readers at Bybit: Use this link to register and open a $500 BTC-USDT position on Bybit Exchange for free!
Disclaimer: Information found on CryptoPotato is those of writers quoted. It does not represent the opinions of CryptoPotato on whether to buy, sell, or hold any investments. You are advised to conduct your own research before making any investment decisions. Use provided information at your own risk. See Disclaimer for more information.
Cryptocurrency charts by TradingView.