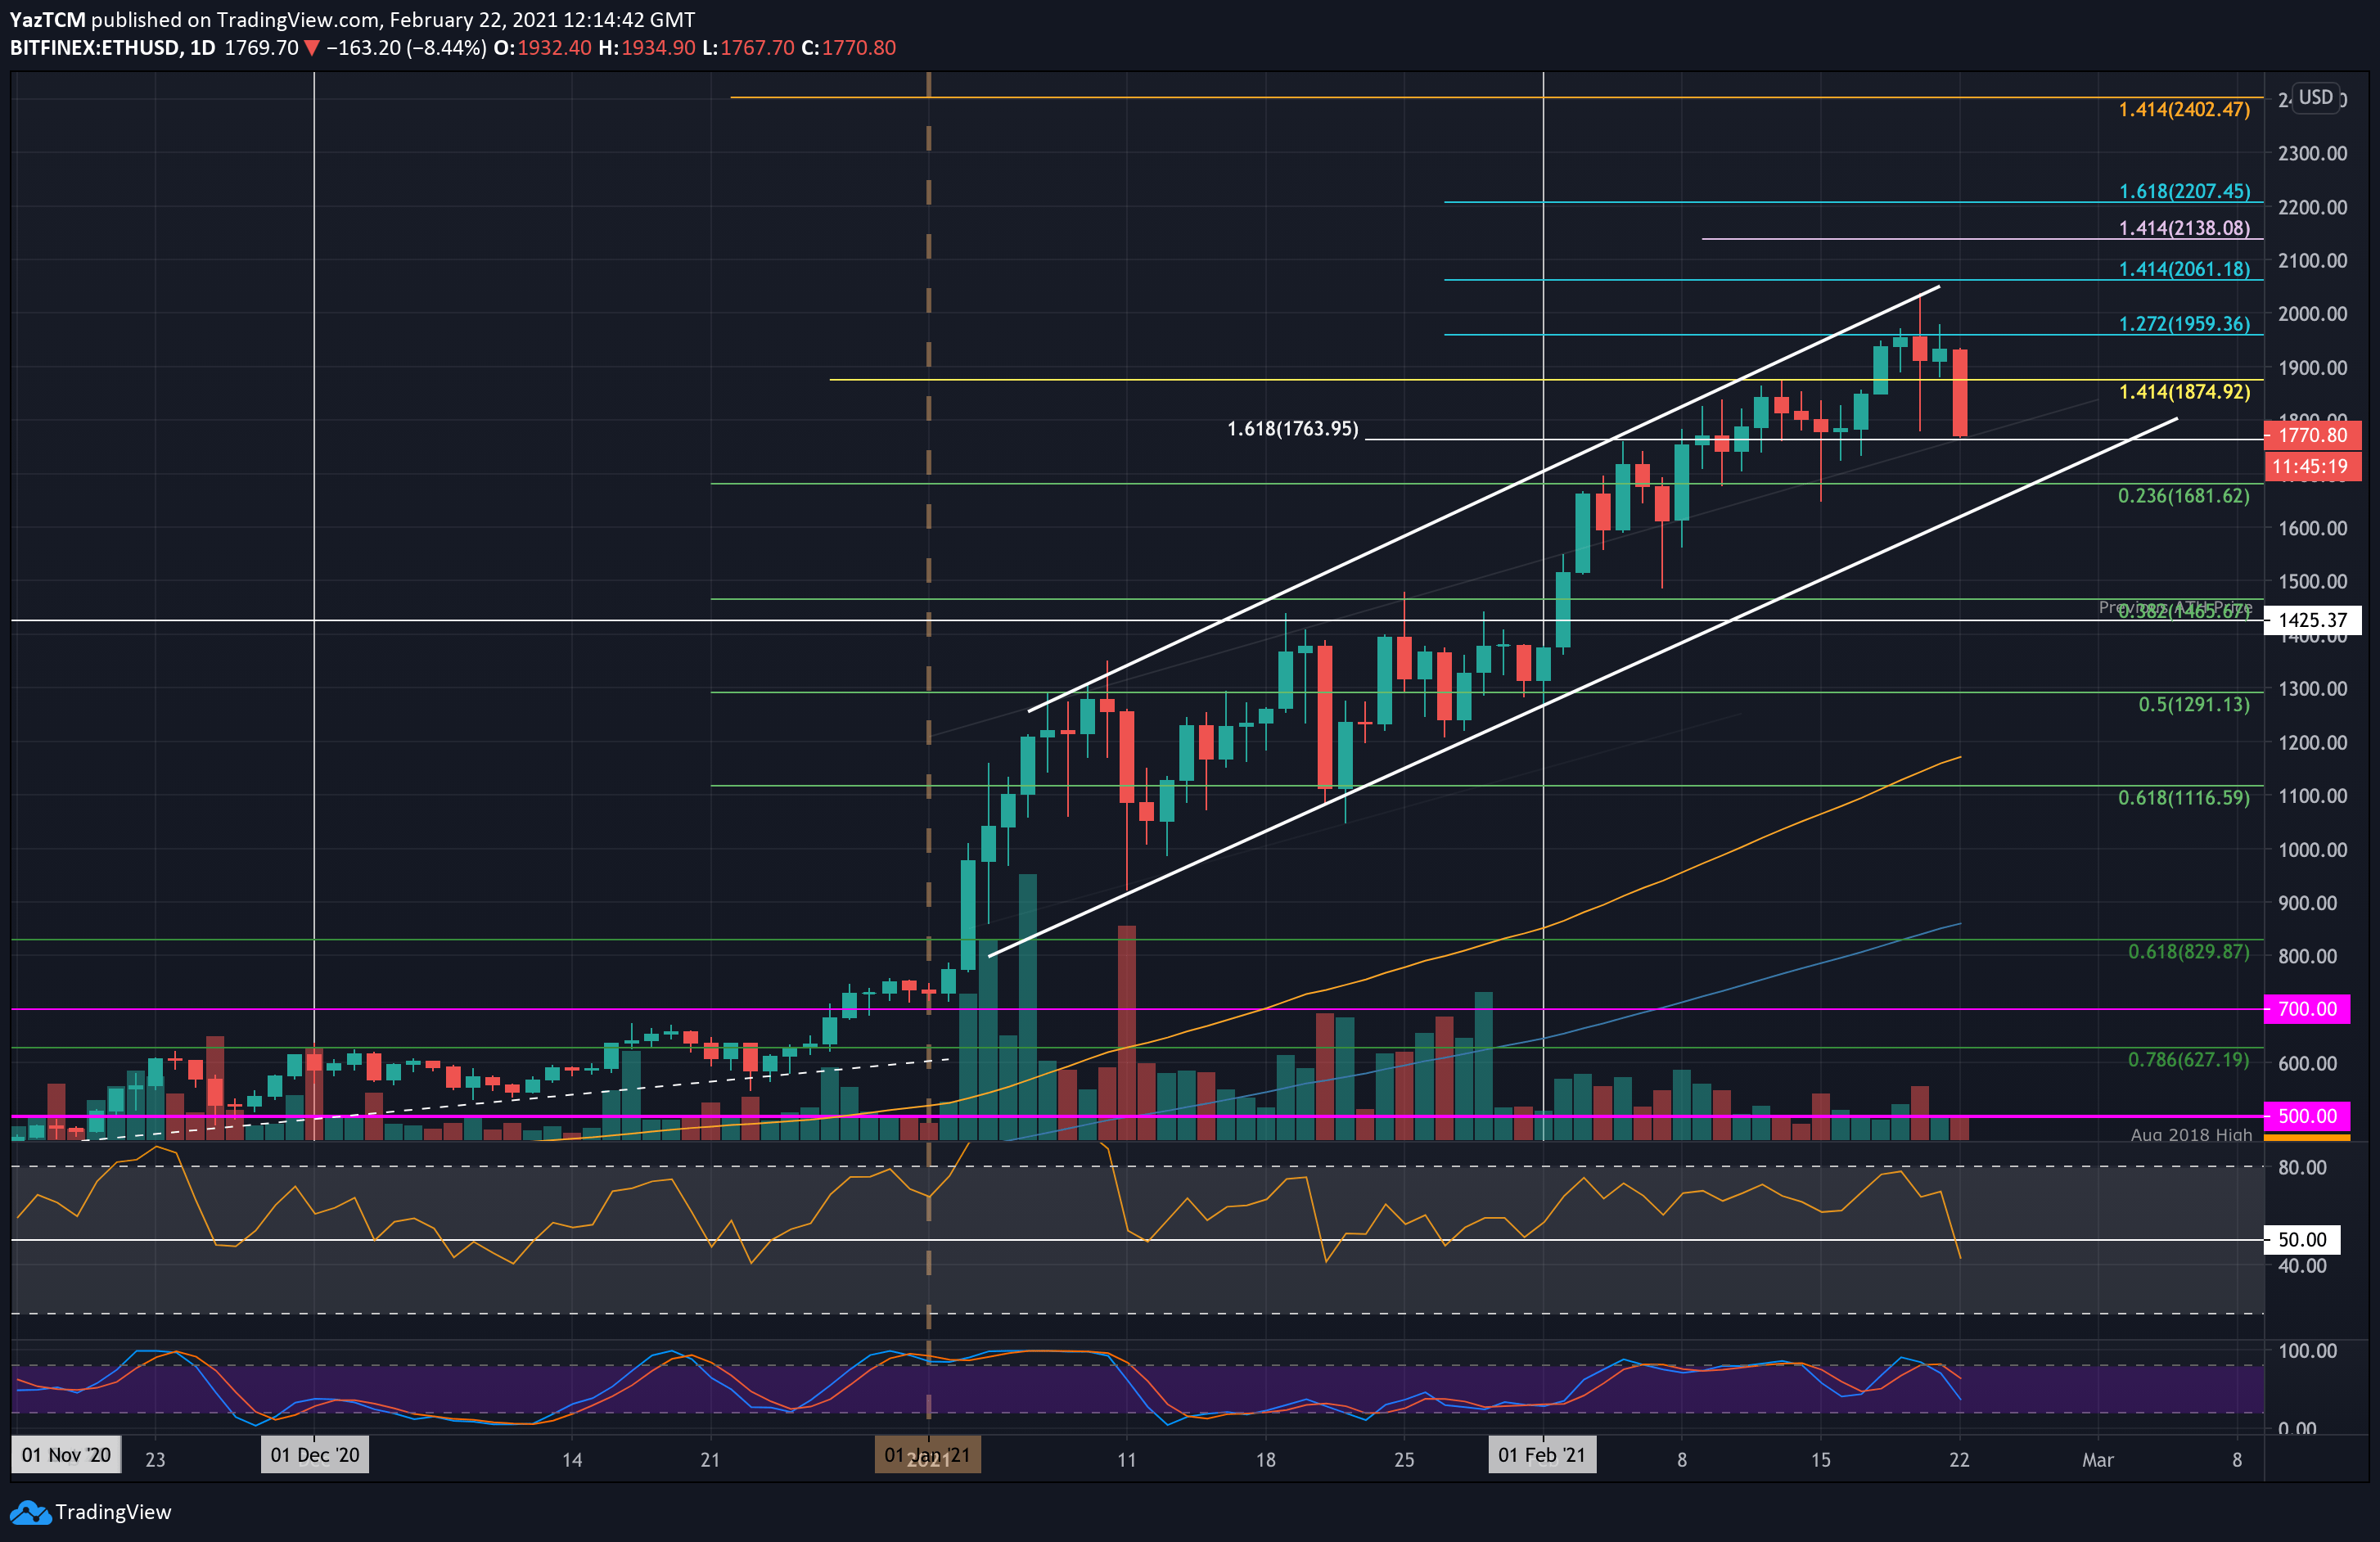
ETH/USD Daily Chart. Source: TradingView
Key Support Levels: $1760, $1681, $1600.
Key Resistance Levels: $1875, $1960, $2000.
Ethereum suffered a steep 10% price drop today as it plummets into the $1760 level. The cryptocurrency has been trading within an ascending price channel for the entire period of 2021.
ETH had pushed higher over the weekend as it managed to break resistance at $2000 and reach the upper boundary of the price channel. Unfrotenutaly, the bulls could not close a daily candle above resistance at $1960 (1.272 Fib Extension), which caused the market to roll over and head lower.
It is now trading around the $1760 support, which provided resistance earlier in the month. It is also supported by a rising trend line.
Looking ahead, if the sellers push beneath $1760, the first support lies at $1681 (.236 Fib). This is followed by $1600 (lower boundary of the price channel), $1500, and $1465 (.382 Fib).
On the other side, the first resistance now lies at $1875 (1.414 Fib Extension – orange), $1960 (1.272 Fib Extension – blue), $2000, and $2061 (1.414 Fib Extension – bue).
The daily RSI recently dipped beneath the midline for the first time since January 20th. This indicates the bears are attempting to gain control of the market momentum. If it continues to fall, the bearish momentum will increase and is likely to drive ETH to the lower boundary of the price channel.
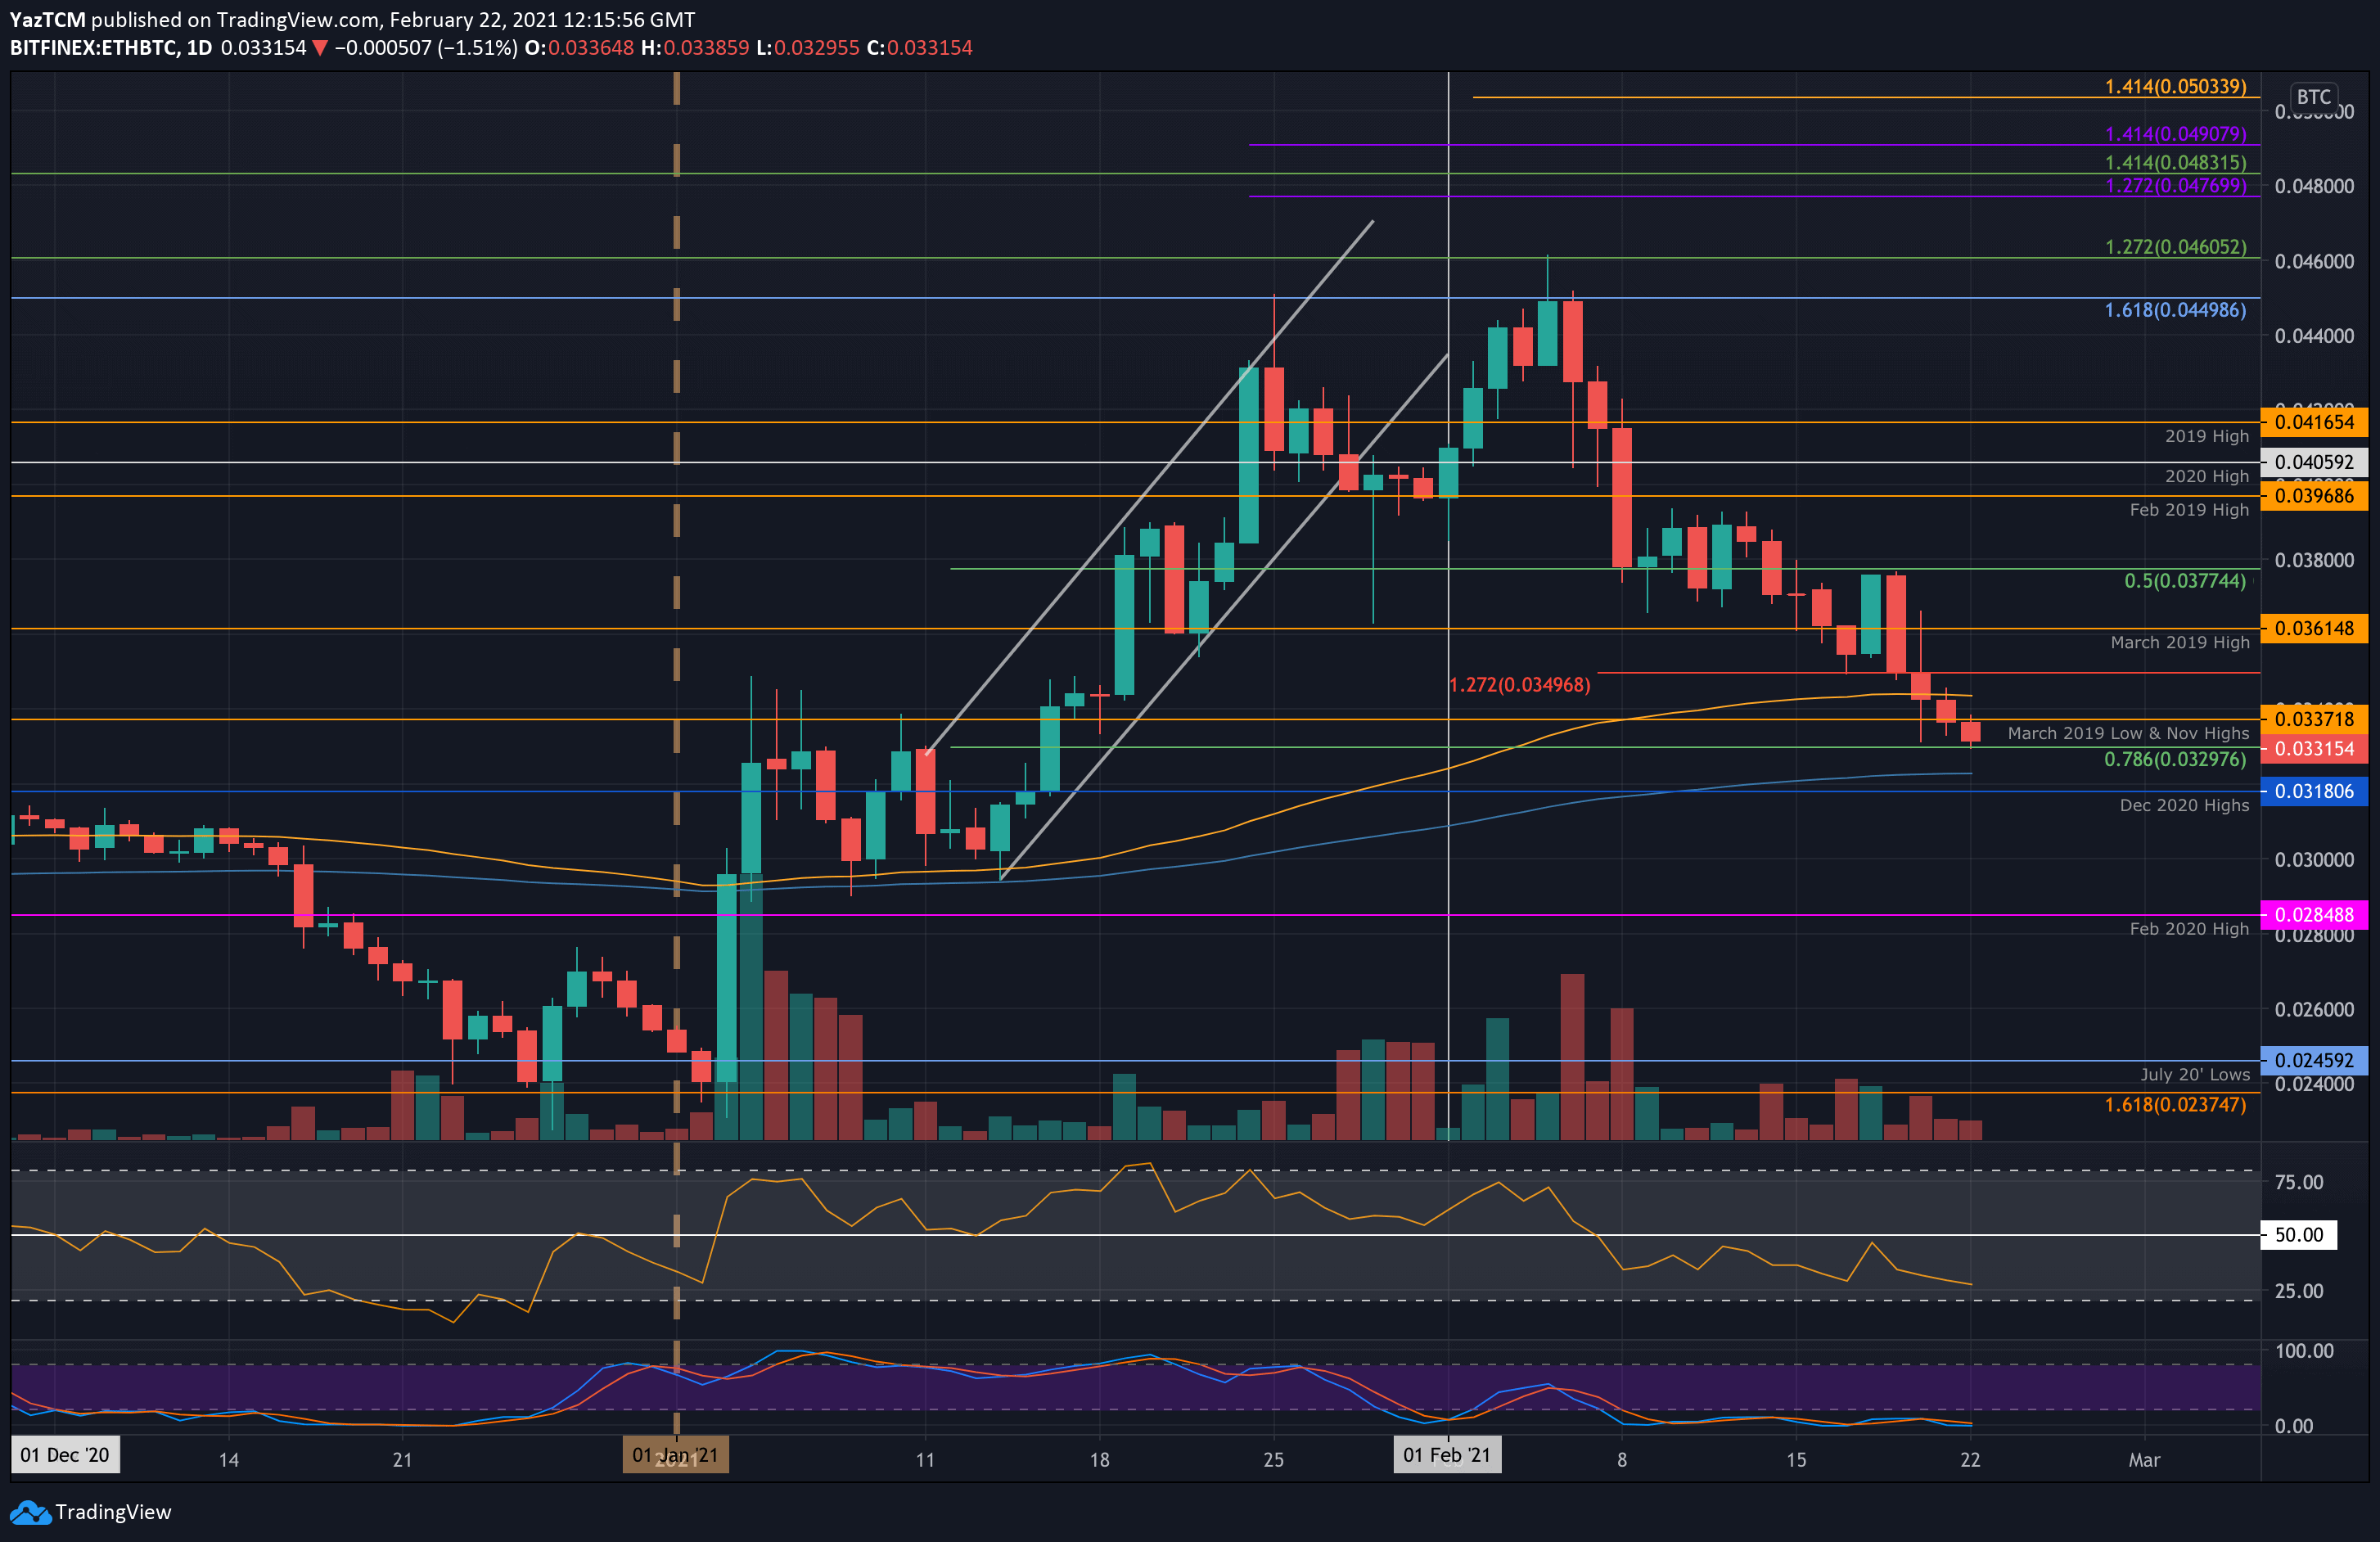
Key Support Levels: 0.0392 BTC, 0.023 BTC, 0.0318 BTC.
Key Resistance Levels: 0.0337 BTC, 0.036 BTC, 0.038 BTC.
Against Bitcoin, Ethereum continues to struggle as it is now down by a steep 28% from the monthly high of 0.046 BTC. The cryptocurrency had dropped into support at 0.0349 BTC (downside 1.272 Fib Extension) at the end of last week, and it continued to dip lower over the weekend.
It is now trading at a new monthly low, at a level not seen since January 16th – the 0.0329 BTC support – provided by a .786 Fib Retracement level.
Looking ahead, the first support beneath 0.0392 BTC lies at 0.032 BTC (200-days EMA). This is followed closely by 0.0318 BTC (December 2020 Highs), 0.03 BTC, and 0.0284 BTC (Feb 2020 Highs).
On the other side, the first resistance lies at 0.0337 BTC (November 2020 highs). This is followed by 0.036 BTC, 0.0361 BTC, ad 0.038 BTC.
The RSI is well within the bearish favor and has been since early February when it dropped beneath the midline. It is still yet to become extremely oversold, indicating there is still room for the bears to drive ETH/BTC lower.