Ethereum has seen a promising increase of 4.35% this week which allowed it to reach $183. This recent increase is largely attributed to the solid rebound that Ethereum has been experiencing against BTC. Over the past 4 days, ETH has surged by 10%, reaching the current price at 0.0176 BTC. If the cryptocurrency can continue to increase against Bitcoin, we may see ETH slowly grinding higher above $200.
Ethereum remains the second-largest cryptocurrency with a market cap of $19.58 billion.
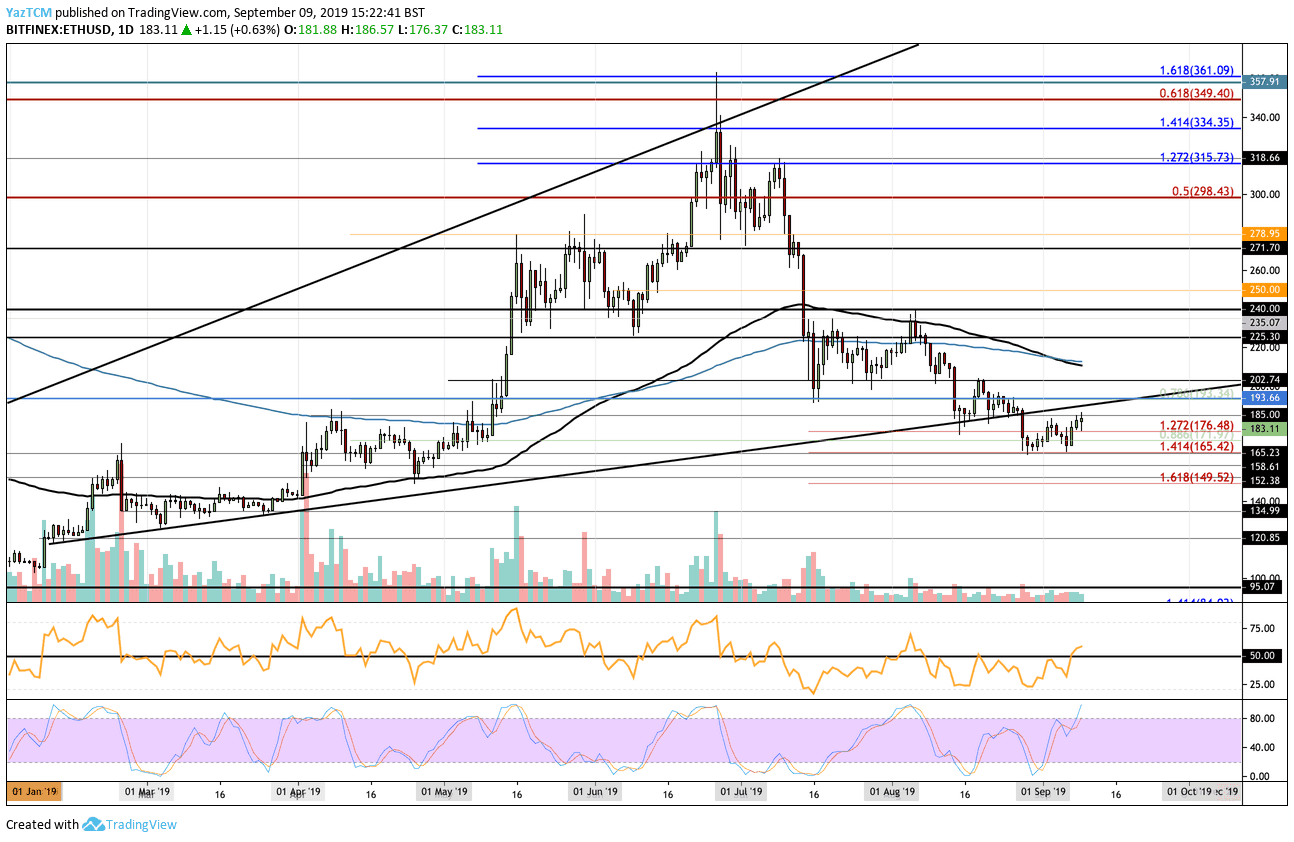
Looking at the ETH/USD 1-day chart:
- Since our previous ETH/USD analysis, ETH started to climb back slowly above the $170 level. The cryptocurrency has recently reached the resistance at $185 but has stalled ever since.
- From above: The nearest level of resistance lies directly at $185. Above this, higher resistance is found at the previous rising support trend line and then at $194. If the buyers can continue to push the price further, resistance can be expected at $200, $202, $210, and $213. The resistance between $210 and $213 is bolstered by both the 100-days EMA and 200-days EMA.
- From below: The nearest level of support lies at $171. Beneath this, support can be found at $165, $160, $158, $152, and $148.52.
- The trading volume is steady but showing signs that it may increase.
- The RSI has recently penetrated above the 50 level after staying below it for most of August. If it can continue to climb higher, we should see ETH making its way above $200.
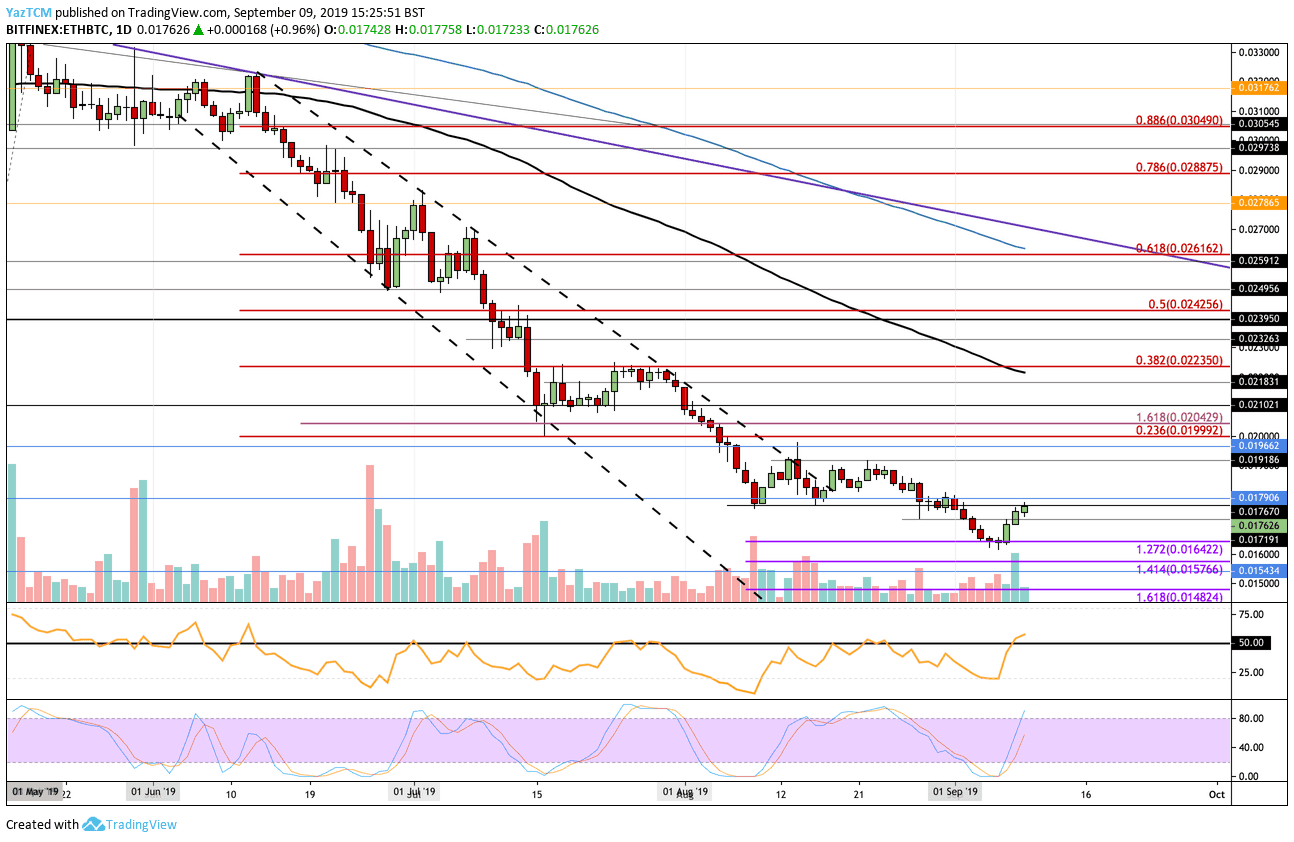
Looking at the ETH/BTC 1-day chart:
- Ethereum has shown very promising sings against Bitcoin after jumping off the support around 0.0165 BTC. ETH has risen by 10% since then and has recently met the resistance at 0.0176 BTC.
- From above: The nearest levels of resistance lie at 0.01790 BTC and 0.018 BTC. Above this, resistance is found at 0.01918 BTC, 0.01966 BTC, 0.020 BTC, and 0.0204 BTC. If the buyers continue to drive the price higher, resistance can be expected at 0.021 BTC, 0.02190 BTC (100-days EMA), 0.02230 BTC, 0.0024 BTC, and 0.0025 BTC.
- From below: The nearest level of support lies at 0.01720 BTC. Beneath this, support is found at 0.017 BTC, 0.01642 BTC, 0.016 BTC, 0.01576 BTC, and 0.01534 BTC.
- The trading volume remains low but has seen some surge over the past few days.
- The RSI has also managed to break above the 50 level for the first time since late May. If it can continue to climb higher, we should see ETH making its way toward 0.002 BTC.
SPECIAL OFFER (Sponsored)
LIMITED OFFER 2024 for CryptoPotato readers at Bybit: Use this link to register and open a $500 BTC-USDT position on Bybit Exchange for free!
Disclaimer: Information found on CryptoPotato is those of writers quoted. It does not represent the opinions of CryptoPotato on whether to buy, sell, or hold any investments. You are advised to conduct your own research before making any investment decisions. Use provided information at your own risk. See Disclaimer for more information.
Cryptocurrency charts by TradingView.