Key Resistance Levels: $226, $237, $246
Key Support Levels: $211, $200, $191
There’s no doubt that the bulls are coming up again following the latest buying volume in the entire crypto market. Ethereum’s price jumped 10% in two days before it met resistance and pulled back slightly.
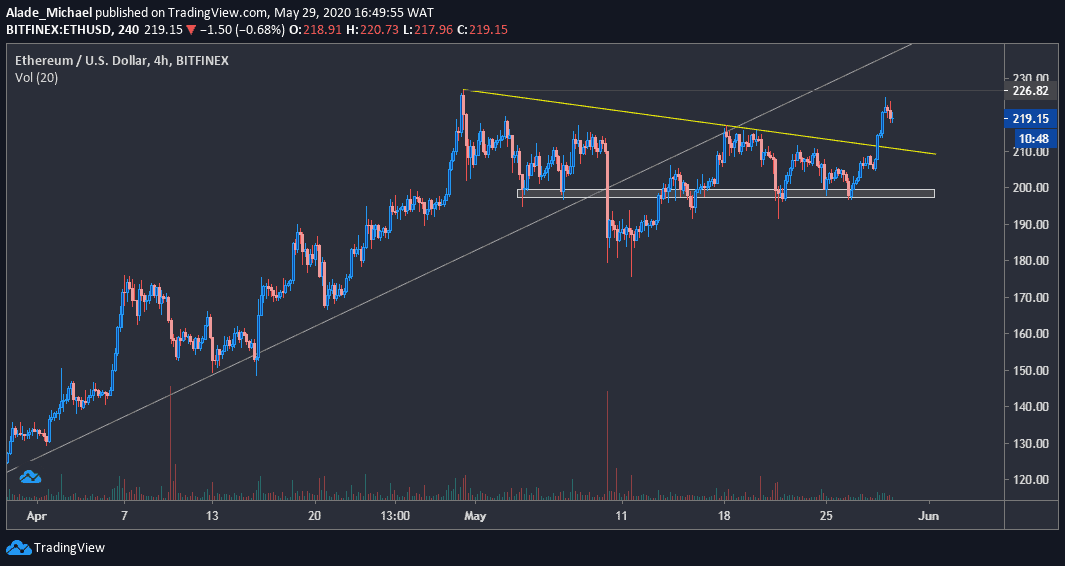
After dropping below a 9-week trend line, as spotted on the 4-hours chart, Ethereum found support around $172 and started to regain momentum towards $200 – which eventually became a support area after breaking through. Following this recovery, ETH climbed above a 4-week descending trend line that was forming since April 30.
The price is now floating around $219 against the US Dollar due to a quick rejection at around $224 today.
From $200, Ethereum saw a nice 10% gain to reach $224 over the last 48-hours, although it has lost $5 from today’s high. If the price continues to pullback, the potential support to watch is $211, above the yellow trend line.
A break down may take the price back into the grey demand area of $200. There’s slight support at $191, but the major to keep in mind is $172 (where ETH found support on May 12) in case of a further plunge.
While reaching $224 mark today, Ethereum still needs to retain April’s high of $226 before advancing higher to $237 and $246. It may have to push above the grey ascending trend line to confirm a mid-term bullish trend.
Key Resistance Levels: 0.0241 BTC, 0.025 BTC, 0.026 BTC
Key Support Levels: 0.023BTC, 0.0222 BTC, 0.0218 BTC
Following Bitcoin’s latest price increase, Ethereum saw about 8% growth over the last two days. Meanwhile, the past two weeks’ increase shows that buyers are showing a strong interest in the second-largest cryptocurrency. From a monthly low of 0.0207 BTC, Ether is now trading at 0.0233 BTC.
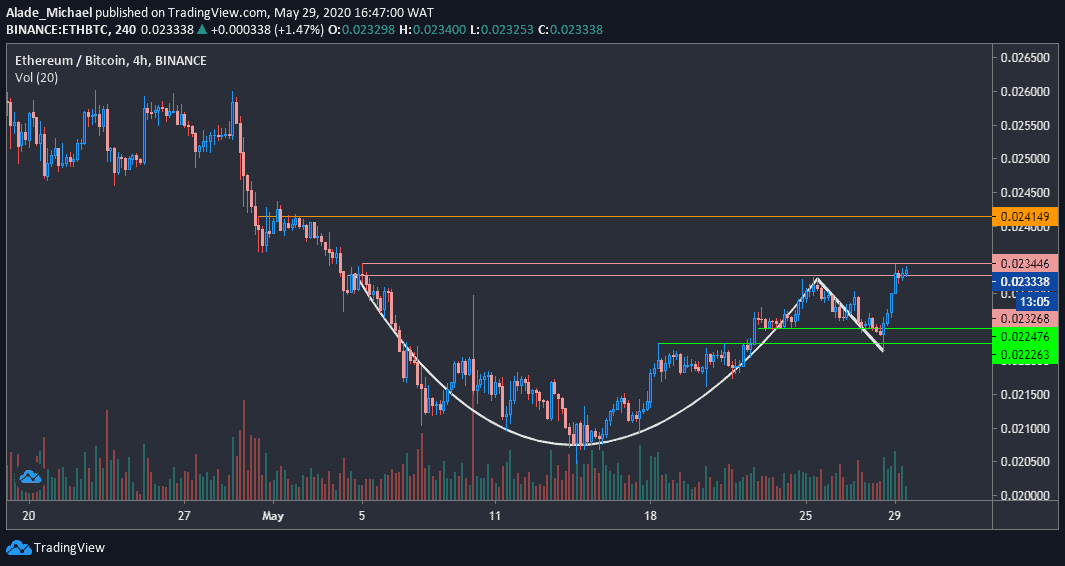
Looking at the bigger picture, Ethereum recently formed a strong bullish trajectory with a cup-and-handle pattern, as can be seen on the 4-hours. Though, the price is currently stuck in a supply zone.
Despite that, the bullish trajectory is still much valid. Once it breaks through this crucial zone of 0.023 BTC – 0.0234 BTC, it would clear the way for more gains.
If the price increases above this supply zone, the immediate resistance level to watch here is 0.0241 BTC – indicated orange on the price chart. After that, subsequent resistance may surface around 0.025 BTC and 0.026 BTC.
There’s small support at 0.023 BTC in case of a pullback. However, the strong support is located at0.022 BTC. If the price plunges below these green lines, the next target for the bears would be 0.0218 BTC.