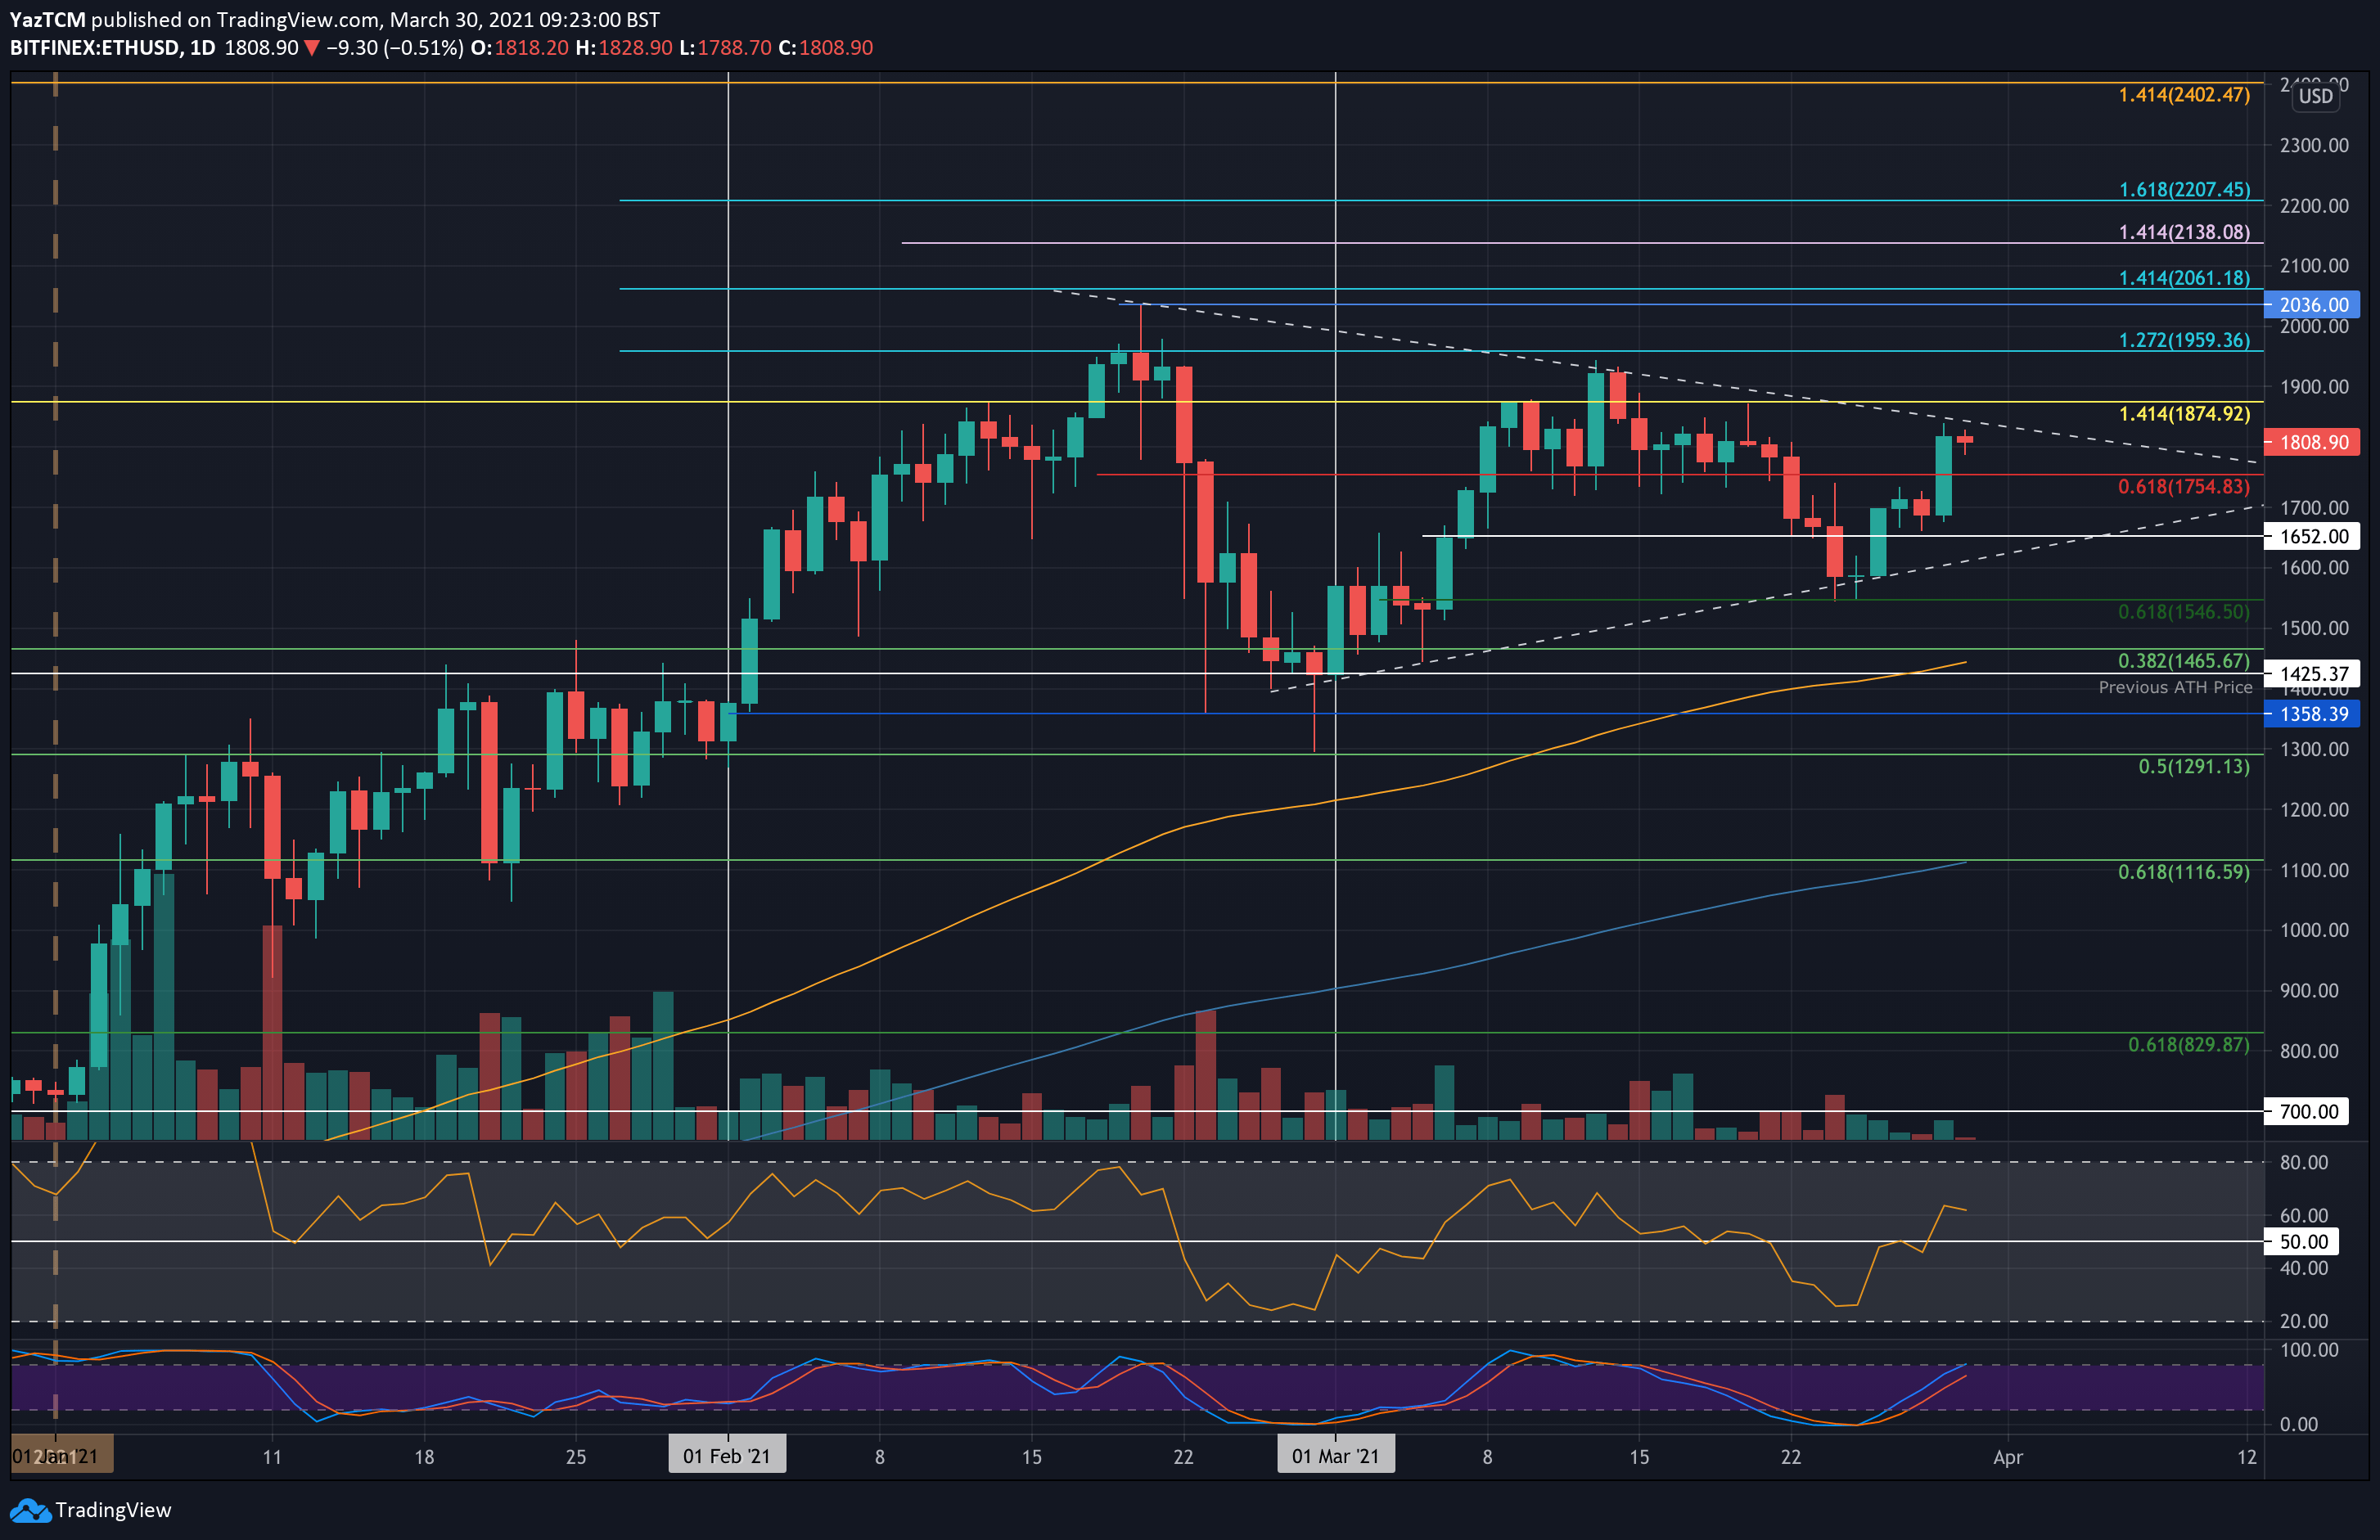
ETH/USD Daily Chart. Source: https://www.tradingview.com/x/aGwVs2N4/
Key Support Levels: $1800, $1755, $1700
Key Resistance Levels: $1820, $1875, $1900.
Last week, Ethereum had dropped from resistance at $1875 as it fell into the support at $1545 (.618 Fib). This support was further bolstered by the lower angle of a symmetrical triangle pattern, which helped it to rebound on Friday.
The cryptocurrency toyed with the $1700 level over the weekend until it broke higher yesterday to breach resistance at $1755 (bearish .618 Fib) and climb above $1800. It is now facing resistance at the upper angle of a symmetrical triangle pattern.
Looking ahead, the first level of resistance lies at the upper angle of the triangle, around $1820. This is followed by $1875, $1900, $1960 (1.272 Fib Extension), and $2036 (ATH Price).
On the other side, the first level of support lies at $1800. This is followed by $1755, $1700, $1650 (the lower angle of the triangle), and $1600.
The daily RSI is now back above the midline, indicating that the buyers are in charge of the market momentum. ETH should have no trouble breaking the current triangle’s upper angle with the increased momentum if it can continue to rise.
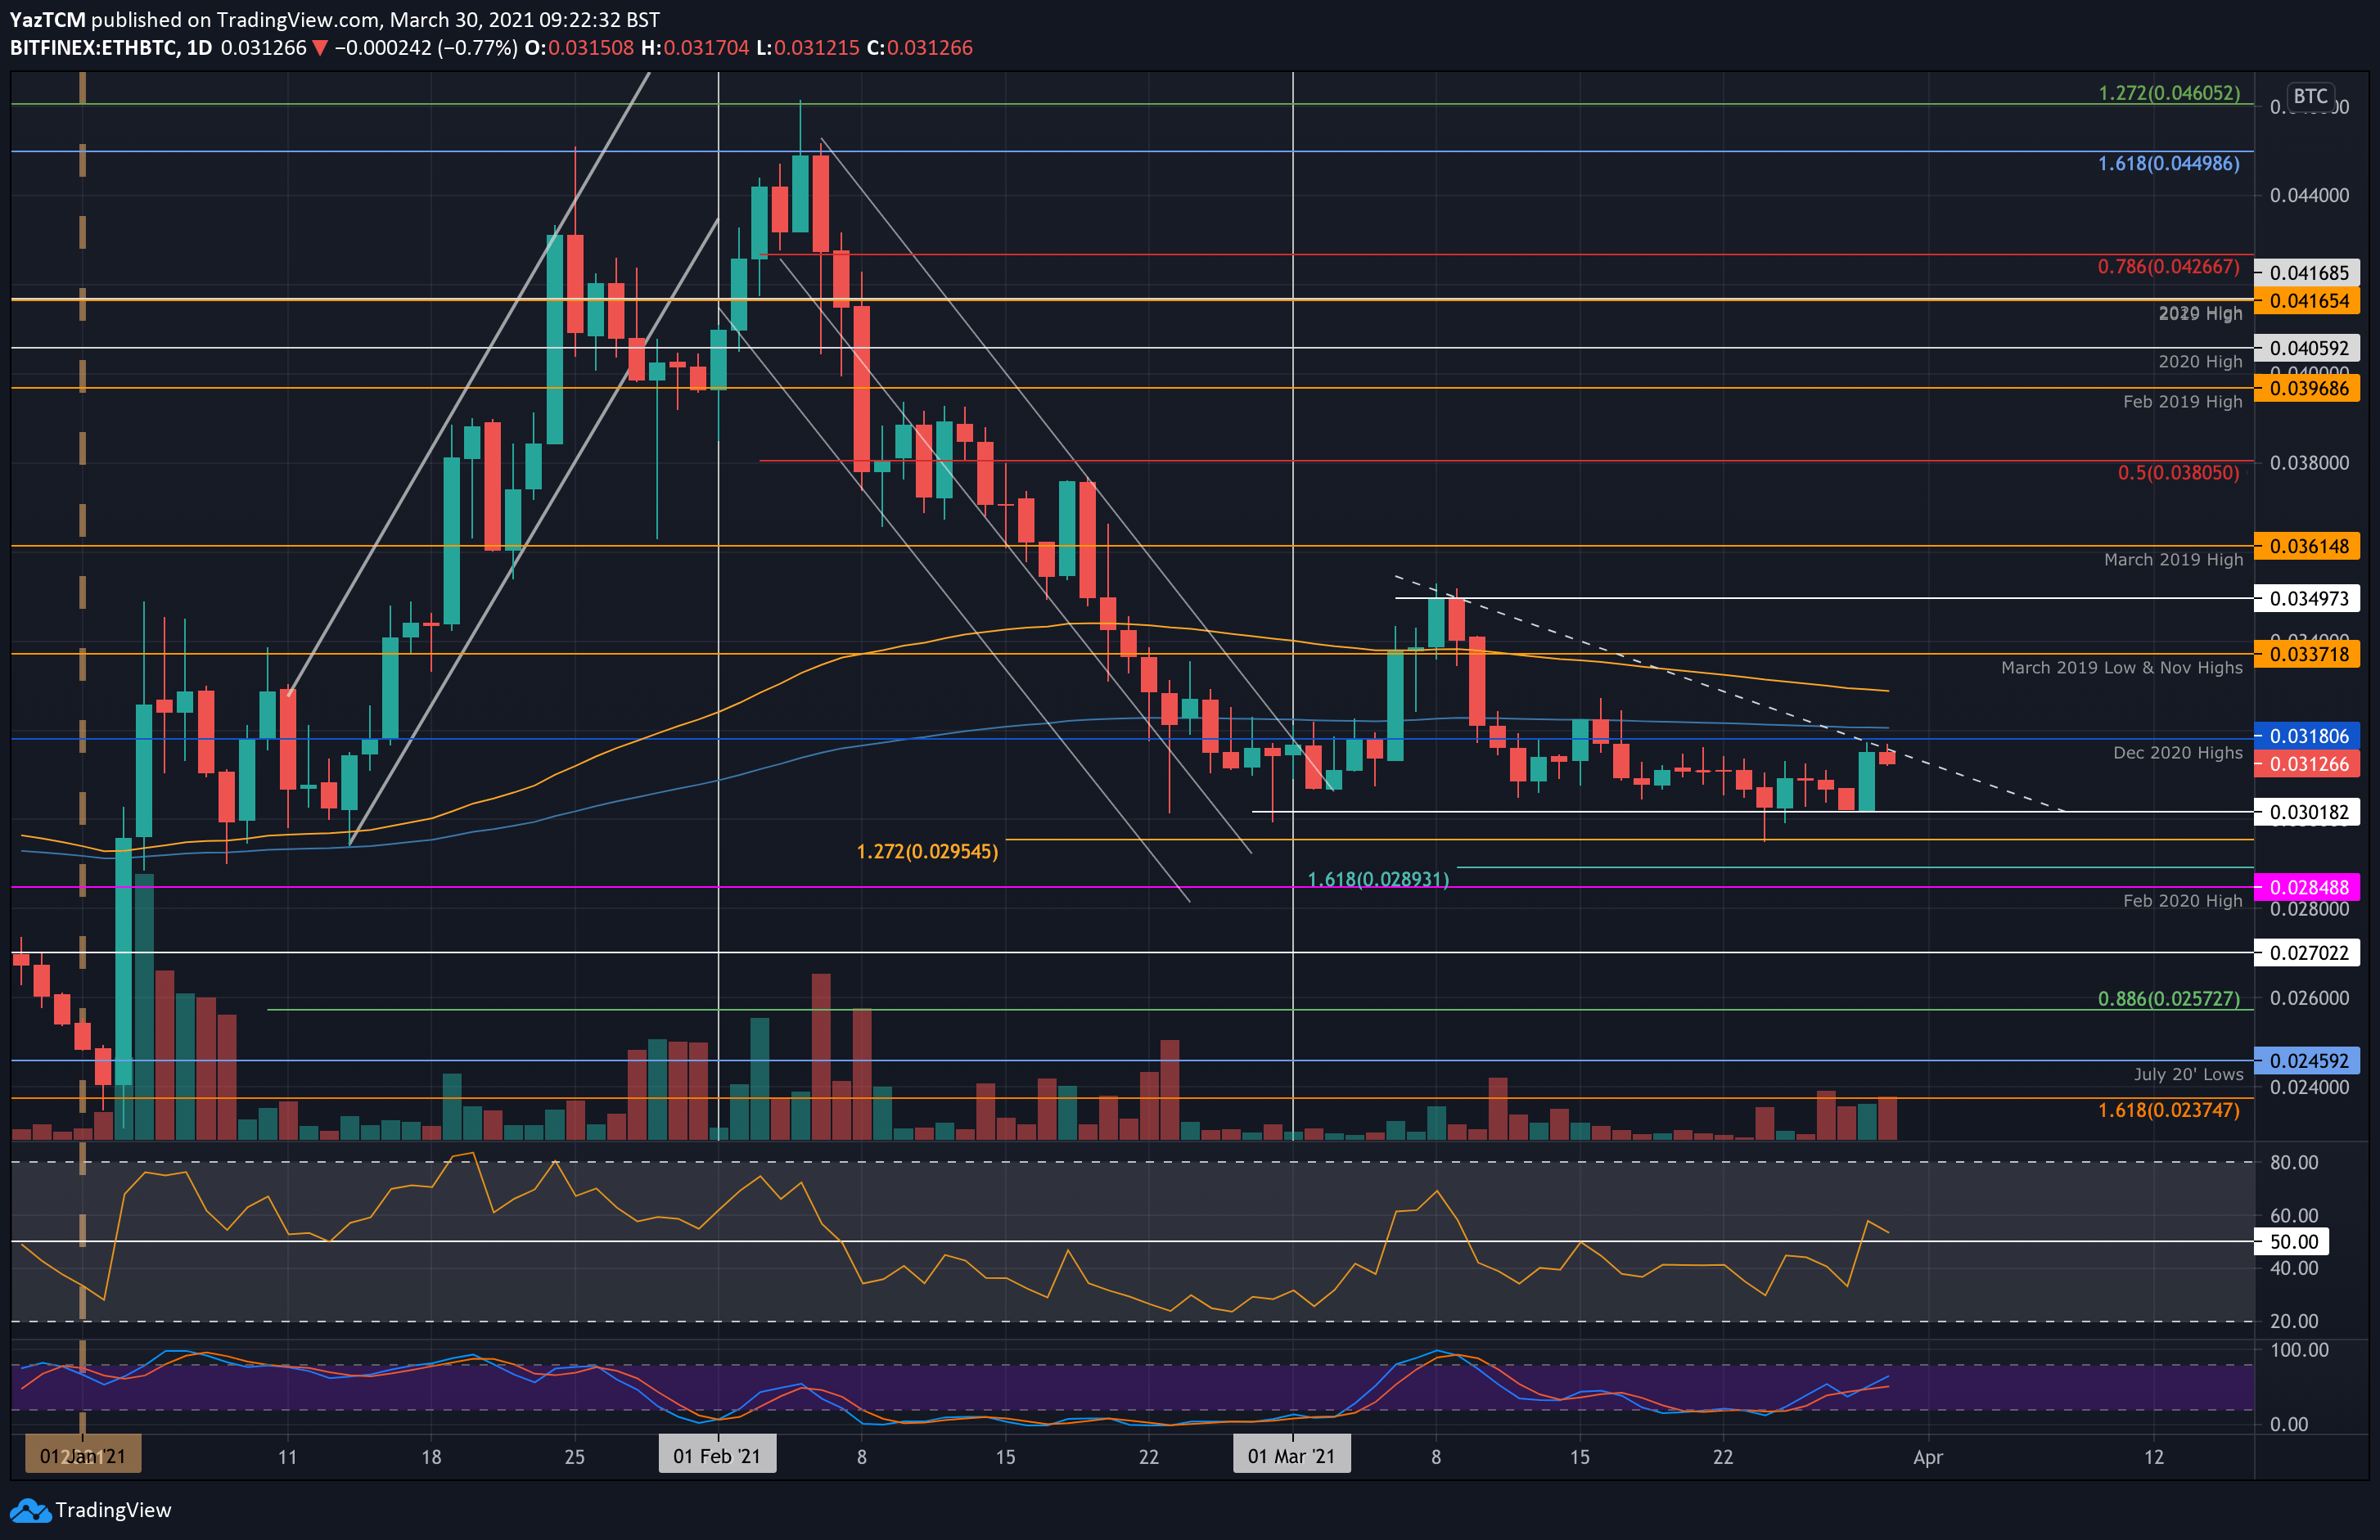
Key Support Levels: 0.0301 BTC, 0.0295 BTC, 0.0289 BTC.
Key Resistance Levels: 0.0318 BTC, 0.032 BTC, 0.0328 BTC.
Ethereum also rebounded from support at 0.0301 BTC yesterday to reach the resistance at the December 2020 highs, around 0.0318 BTC. Prior to this, the cryptocurrency was struggling to push above 0.0315 BTC for the past week.
The market has now formed the making of a descending triangle pattern as it battles with the upper boundary. A breakout toward the upside should allow ETH to make a move toward the March highs of around 0.035 BTC.
Looking ahead, the first level of resistance lies at 0.0318 BTC (December 2020 highs). This is closely followed by 0.032 BTC (200-days EMA). Beyond the 200-days EMA, additional resistance lies at 0.0328 BTC (100-days EMA), 0.0337 BTC (November 2020 highs), and 0.035 BTC (March 2021 highs).
On the other side, the first level of strong support lies at 0.0301 BTC. Beneath 0.03 BTC, support lies at 0.0295 BTC, 0.0289 BTC, and 0.0285 BTC (Feb 2020 Highs).
The RSI also recently broke above the midline yesterday, indicating that the buyers are attempting to regain control of the market momentum for the first time since the first week of March. If it can continue to rise, the increased momentum should push ETH above the descending triangle.