Ethereum has been slipping over the past 24 hours, falling by 4% back below the $300 mark and currently trading around $293. The recent decline is mainly due to Bitcoin’s falling back toward the $11,000 level.
Ethereum currently boasts a $31.5 billion market cap which puts it in second place among the top cryptocurrency projects. ETH has seen an epic 108% price explosion over the past three months – despite the fact that the cryptocurrency’s price has decreased relative to BTC.
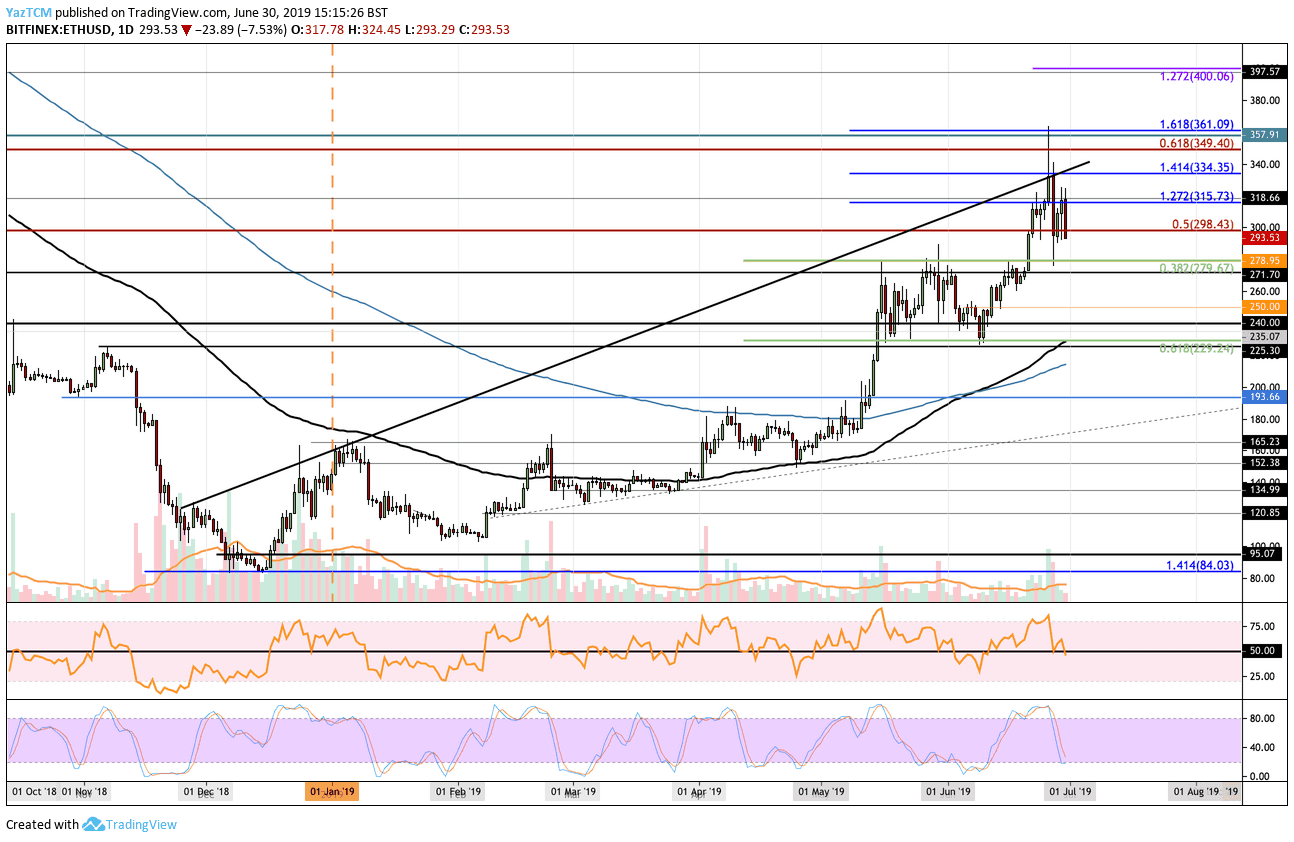
Looking at the ETH/USD 1-day chart:
- Since our previous ETH/USD analysis, the price of Ethereum has risen into the resistance at $360 but was unable to hold at that level. It has since fallen and recently dropped beneath $300.
- From above: The nearest level of resistance now lies at the $300 level. This is followed by higher resistance at $315, $334 and $350. Above $350, further resistance lies at $360, $380 and $400.
- From below: The nearest level of strong support lies at $280, which is the short term .382 Fib retracement level. Beneath this, lower support can be found at $271, $250, $240, $235 and $229 (the .618 Fib retracement level).
- The trading volume has fallen drastically over the past few days following the spike toward $360.
- The Stochastic RSI recently reached oversold conditions as we wait for a crossover signal above to indicate that the buyers are ready to push higher. However, the RSI itself has dropped beneath the 50 level, which could mean there will be more bearish momentum to come.
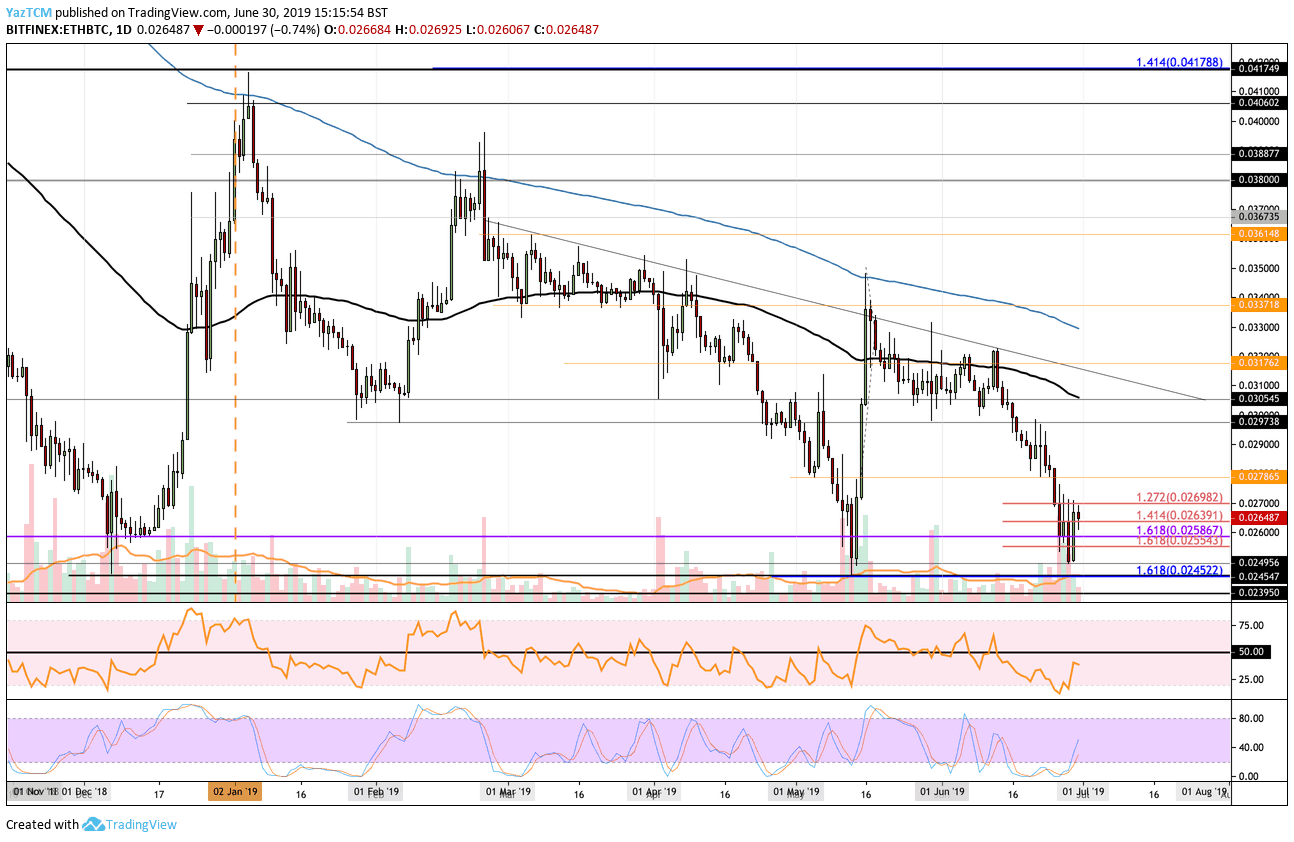
Looking at the ETH/BTC 1-Day Chart:
- Against Bitcoin, ETH fell until finding strong support at our highlighted level of 0.02495 BTC. This support had held the market in May 2019, allowing ETH/BTC to rebound. It has bounced from the support mentioned above to where it is currently trading at around 0.02657 BTC.
- From above: The nearest level of resistance now lies at 0.027 BTC. Above this, higher resistance is located at 0.02786 BTC, 0.028 BTC, 0.029 BTC, and 0.030 BTC – which also contains the 100-day EMA. Above 0.03 BTC, further resistance is located at 0.031 BTC and 0.03176 BTC.
- From below: The nearest levels of support now lie at 0.02639 BTC and 0.026 BTC. Beneath this, further support lies at 0.02586 BTC, 0.02495 BTC, 0.0245 BTC, and 0.02395 BTC.
- Even though the trading volume has decreased slightly, it remains relatively high.
- The Stochastic RSI recently produced a bullish crossover signal which allowed the market to rebound at the support. If it continues to climb, we can expect ETH/BTC to keep on rising.
SPECIAL OFFER (Sponsored)
Binance Free $600 (CryptoPotato Exclusive): Use this link to register new account and receive $600 exclusive welcome offer on Binance (
full details).
LIMITED OFFER 2024 for CryptoPotato readers at Bybit: Use this link to register and open a $500 BTC-USDT position on Bybit Exchange for free!
Disclaimer: Information found on CryptoPotato is those of writers quoted. It does not represent the opinions of CryptoPotato on whether to buy, sell, or hold any investments. You are advised to conduct your own research before making any investment decisions. Use provided information at your own risk. See Disclaimer for more information.
Cryptocurrency charts by TradingView.