Ethereum saw a small 4% increase over the past 24 hours which brought its price back above $170. ETH has lost a total of 20% over the past week, causing the cryptocurrency to plummet from more than $200 to below $165.
Ethereum is the second-largest cryptocurrency with a market cap of $18.61 billion.
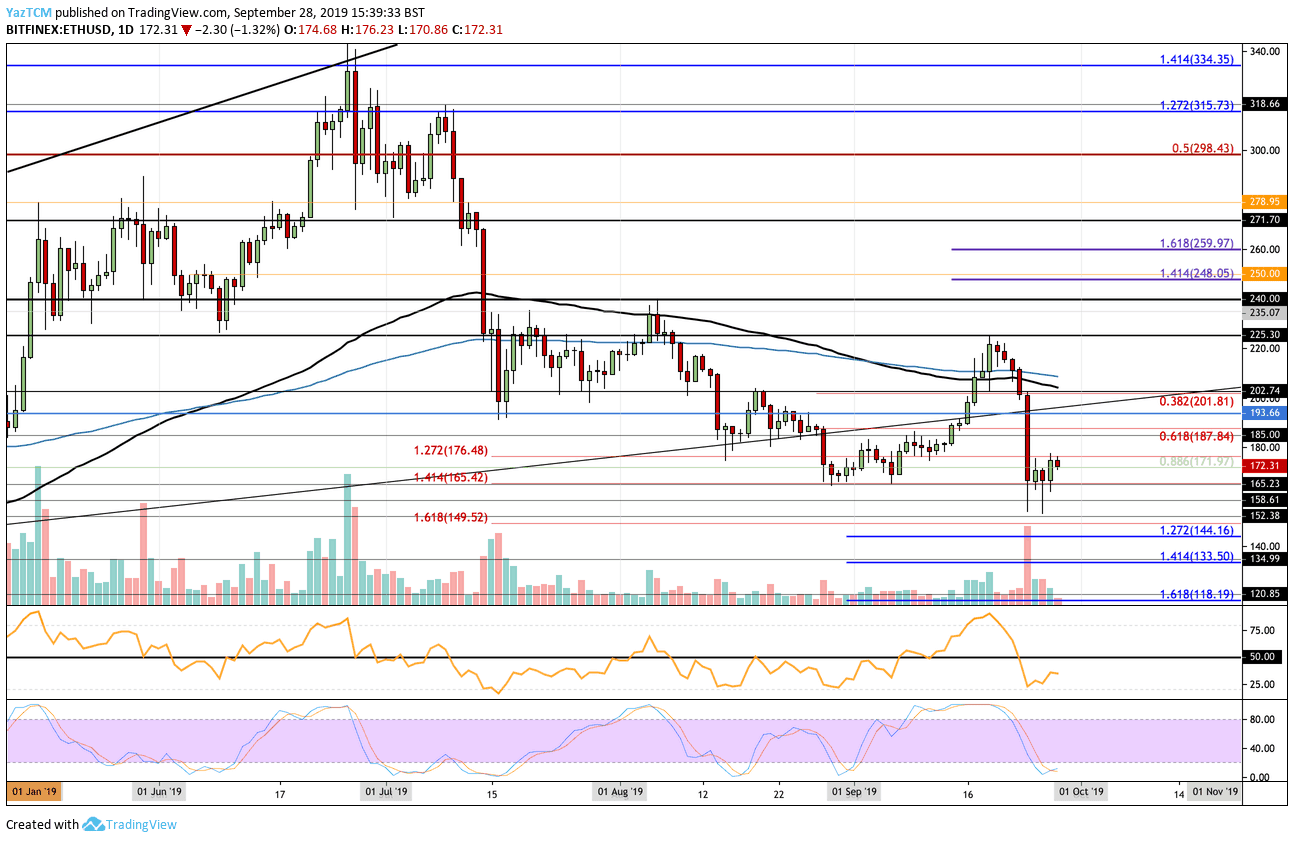
Looking at the ETH/USD 1-day chart:
- Since our previous ETH/USD analysis, ETH has managed to hold the support at $165.42. Ethereum rebounded higher in the previous session but failed to break above resistance at $172.
- From above: The nearest level of resistance lies at $172. Above this, resistance is found at $180, $186, $190, $194, and $200. If the bulls break $200, Ethereum will meet congestions between $202-$210 due to the 100-days & 200-days EMAs being located here. Higher resistance lies at $225, $235, $240, $248, and $250.
- From below: The nearest level of support lies at $170. Beneath this, support is located at $158, $152, and $150. If the market drops beneath $150 support can be found at $144.16, $140, $133.50, and $130.
- The trading volume has decreased after the recent surge.
- The RSI remains beneath 50 but it is climbing. The Stochastic RSI has recently produced a bullish crossover signal which suggests that there could be a bullish rebound.
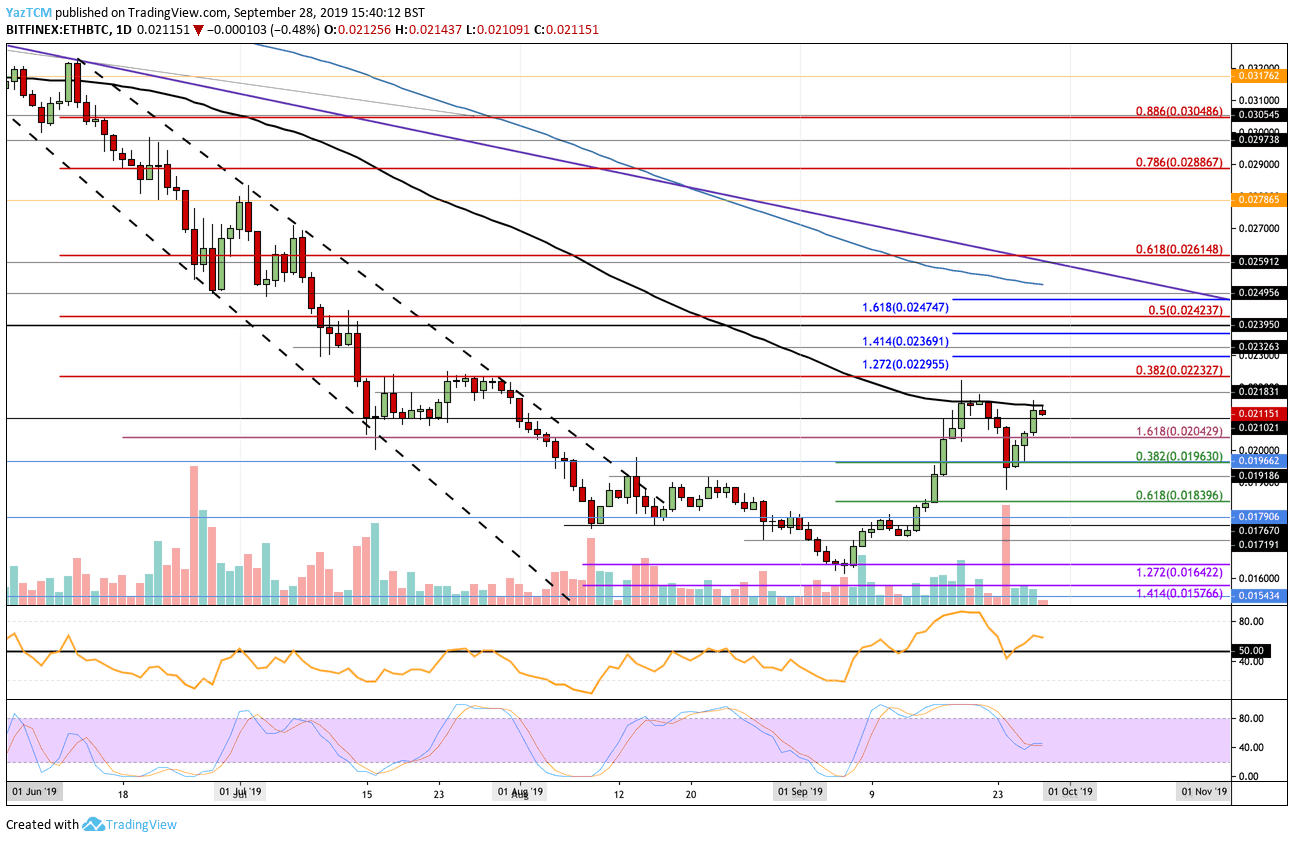
Looking at the ETH/BTC 1-day chart:
- Against BTC, ETH went above the 0.02 BTC level and met resistance at 0.0216 BTC – provided by the 100-days EMA.
- From above: The nearest level of resistance lies directly at the 100-days EMA. Above this, resistance is found at 0.0218 BTC, 0.022 BTC, 0.02243 BTC (bearish .382 Fibonacci Retracement), 0.02295 BTC (1.272 Fib Extension), and 0.02326 BTC. Higher resistance can be expected at 0.02369 BTC, 0.02395 BTC, 0.02423 BTC (bearish .5 Fibonacci Retracement), 0.02474 BTC (1.618 Fibonacci Extension).
- From below: The nearest level of support lies at 0.02 BTC. Beneath this, support is found at 0.01963 BTC (.382 Fib Retracement), 0.019 BTC, 0.01839 BTC (.618 Fib Retracement), and 0.018 BTC.
- The trading volume has decreased and remains at an average level.
- The RSI has managed to remain above the 50 level which shows that the bulls are still in charge of the market momentum.
SPECIAL OFFER (Sponsored)
LIMITED OFFER 2024 for CryptoPotato readers at Bybit: Use this link to register and open a $500 BTC-USDT position on Bybit Exchange for free!
Disclaimer: Information found on CryptoPotato is those of writers quoted. It does not represent the opinions of CryptoPotato on whether to buy, sell, or hold any investments. You are advised to conduct your own research before making any investment decisions. Use provided information at your own risk. See Disclaimer for more information.
Cryptocurrency charts by TradingView.