Chart by TradingView
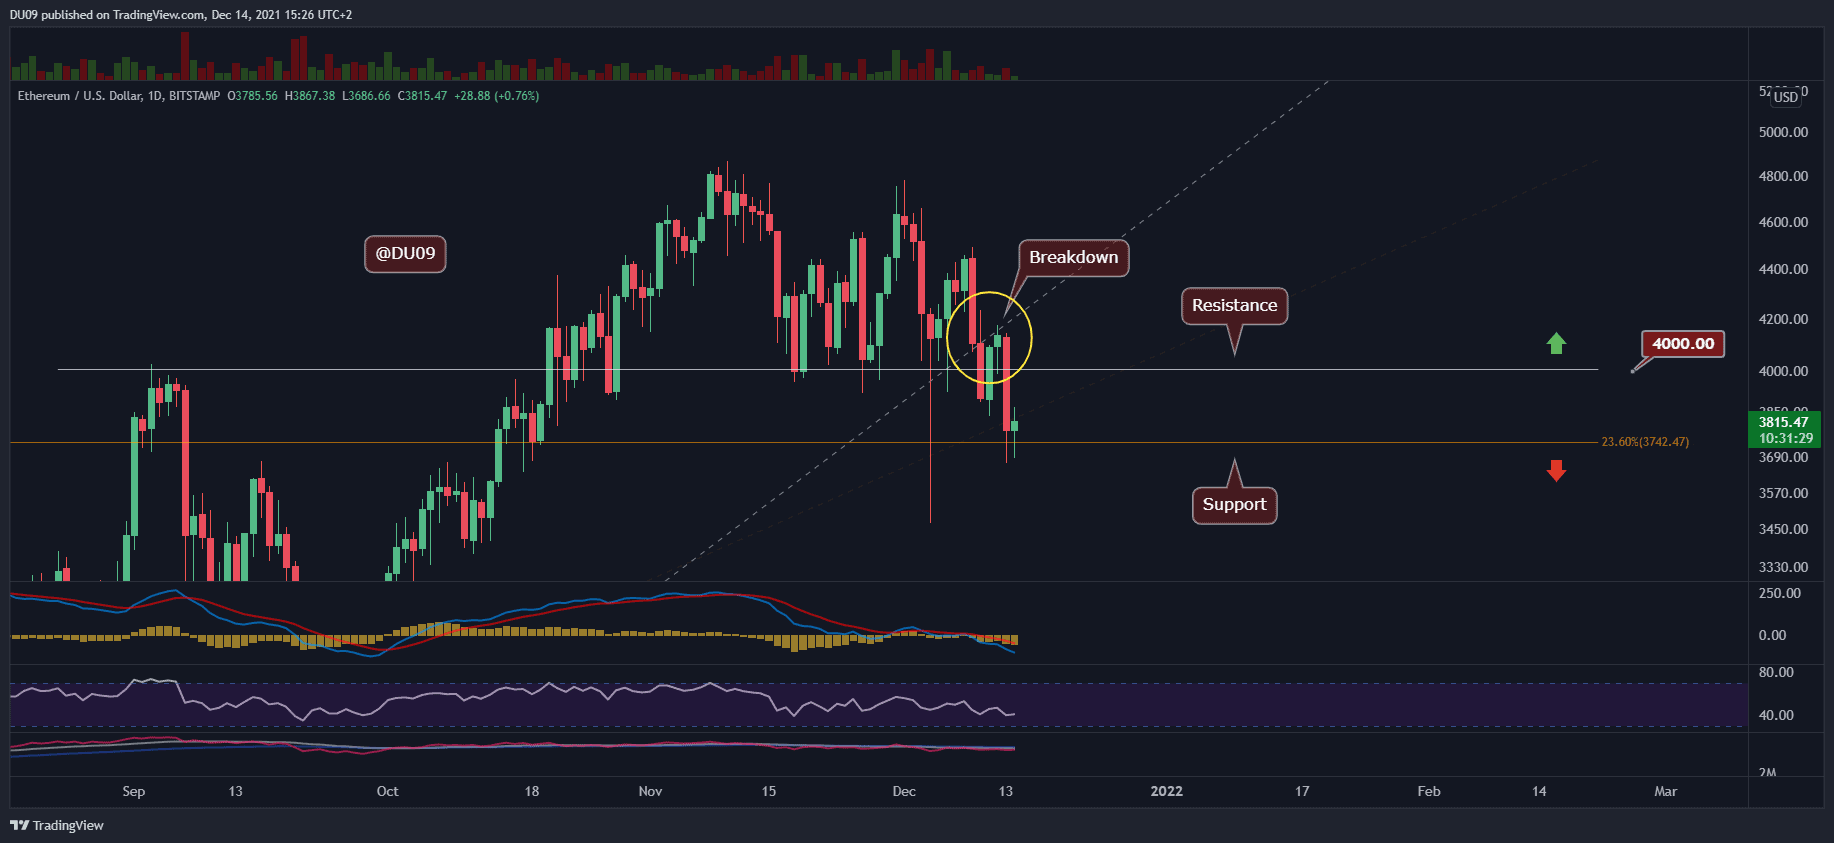
Not only the ETH price dropped below $4,000, but it also closed below this key level on the daily timeframe. If no surprises will take place, today will be the first time since October 19 that ETH is seeing a full candle body below the significant $4K mark. This put an end to the bullish trend, at least in the short term.
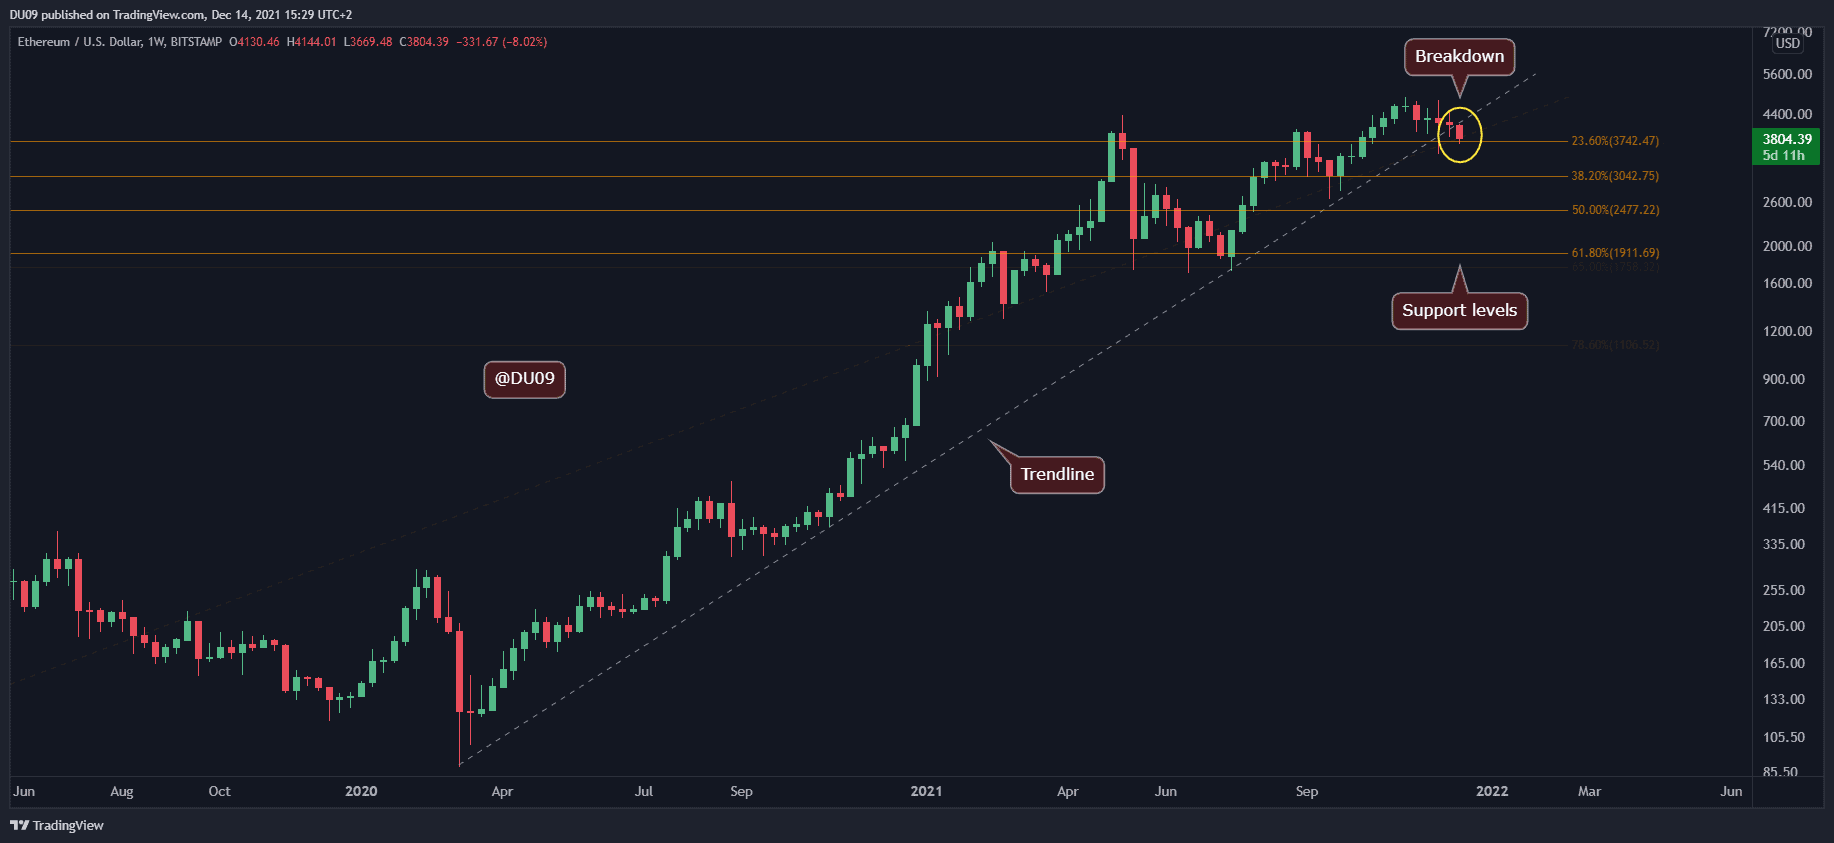
Key Support levels: $3750, $3,000
Key Resistance levels: $4,000, $4,500
Last week, the weekly MACD went through a bearish crossover which was an early sign that the uptrend may reverse. Yesterday, ETH broke below the key support at $4,000 and closed the day under this key level. In doing so, ETH confirmed the change in the trend and also broke beneath a significant trendline that has held the uptrend since March 2020 (see the dotted line as shown below).
Following the breakdown, the $4,000 level now becomes a key resistance. In addition, ETH is currently trading below the 100-day moving average line. If this downtrend continues, then the next critical support levels for ETH are found at $3750 and $3,000.
Trading Volume: The breakdown below $4,000 was followed by a high amount of volume. Price also turned the March 2020 trendline into resistance after getting rejected by it on high volume. This shows that the sellers have the upper hand and are in control of the market.
RSI: The RSI is making lower lows on the daily timeframe, indicating a bearish trend. However, this last breakdown has not pushed the RSI below 40 points. There is plenty of room for RSI to fall until it reaches the oversold area at under 30 points.
MACD: As mentioned above, the weekly MACD had gone through a bearish cross last week which only intensified this week. This is a very significant bearish signal and can be interpreted as a trend reversal. When this last happened in May 2021, it took ETH two months to return back to the uptrend.
The bias for ETH is bearish. Unless the price reclaims $4,000 it is hard to be bullish here.
ETH lost a key support level and the sellers are dominating the price action. If the price cannot make a recovery soon, then this will only strengthen the bearish bias and push ETH to the next support levels at $3,750 and maybe even to $3,000 in the mid-longer term.