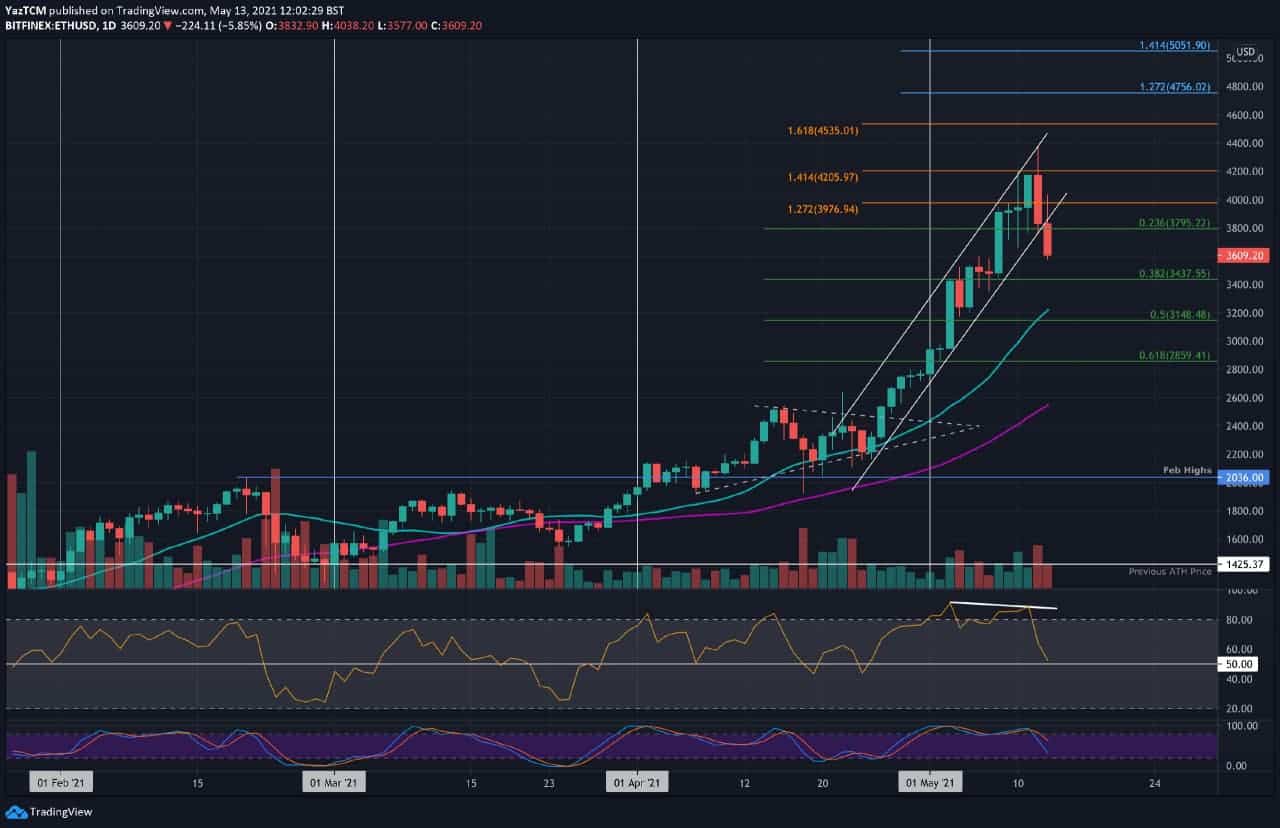
ETH/USD Daily Chart. Source: TradingView
Key Support Levels: $3,577, $3,437, $3,250.
Key Resistance Levels: $4,000, $4,205, $4,373.
Ethereum is down by a sharp 14% over the past 24-hours as the coin drops beneath $4,000 and breaks below the narrow ascending price channel. It was trading inside this channel since the last week of April as it hit a new all-time high of $4,373 yesterday, where it found the resistance at the upper boundary of the channel.
Today, a steep decline in BTC caused ETH to drop quite significantly. It started toward the end of yesterday’s candle, which caused it to close around $3,800 (.236 Fib). Today, the price fall continues as ETH dropped beneath the price channel to hit a low of $3,577. It has since bounced back above $3,600, but the break of the channel is quite significant.
Looking ahead, the first support lies at today’s low of $3,577. This is followed by $3,437 (.382 Fib), $3,250 (20-days MA0, $3,150 (.5 Fib), and $3,000.
On the other side, the first resistance now lies at $4,000. This is followed by $4,205 (1.414 Fib Extension), $4,373 (ATH), and $4,535 (1.618 Fib Extension).
The RSI was showing hints of bearish divergence before the large sell-off. Interestingly, it still remains above 60. This indicates that there is still weak bullish momentum within the market, and the bears have still not taken over.
Key Support Levels: 0.075 BTC, 0.0724 BTC, 0.07 BTC.
Key Resistance Levels: 0.077 BTC, 0.08 BTC, 0.0838 BTC.
Against bitcoin, Ether is also trading in an ascending price channel and has not broken to the downside. Yesterday, ETH surged as high as 0.08 BTC but struggled to close the daily candle above resistance at 0.077 BTC (1.414 Fib Extension).
Today, ETH dropped slightly and is now trading at 0.0753 BTC.
Looking ahead, the first support lies at 0.075 BTC (lower boundary of the channel). Beneath the channel, added support lies at 0.0724 (.236 Fib), 0.07 BTC, 0.0677 BTC (.382 Fib), and 0.0638 BTC (.5 Fib).
On the other side, the first strong resistance lies at 0.077 BTC (1.414 Fib Extension). This is followed by 0.08 BTC, 0.0838 BTC (1.618 Fib Extension), 0.0866 BTC (1.414 Fib Extension – blue), and 0.09 BTC.
The RSI is still strongly in the bulls’ favor here – although it is starting to point lower. If it continues to head lower, the bullish momentum will start to decrease and might lead to a short-term retracement.