Key Support Levels: $159, $147, $136
Key Resistance Levels: $177, $188, $200
Against USD, Ethereum’s price saw massive growth over the last couple of weeks. At the time of writing, ETH is priced at around $168, with approximately 2.68% gains over the last 24-hours.
However, we need to see a significant increase above $180 before we can consider a mid-term bullish continuation. Statistically, the second-largest cryptocurrency is holding an $18.4 billion market cap with a trading volume of over $1.9 billion.
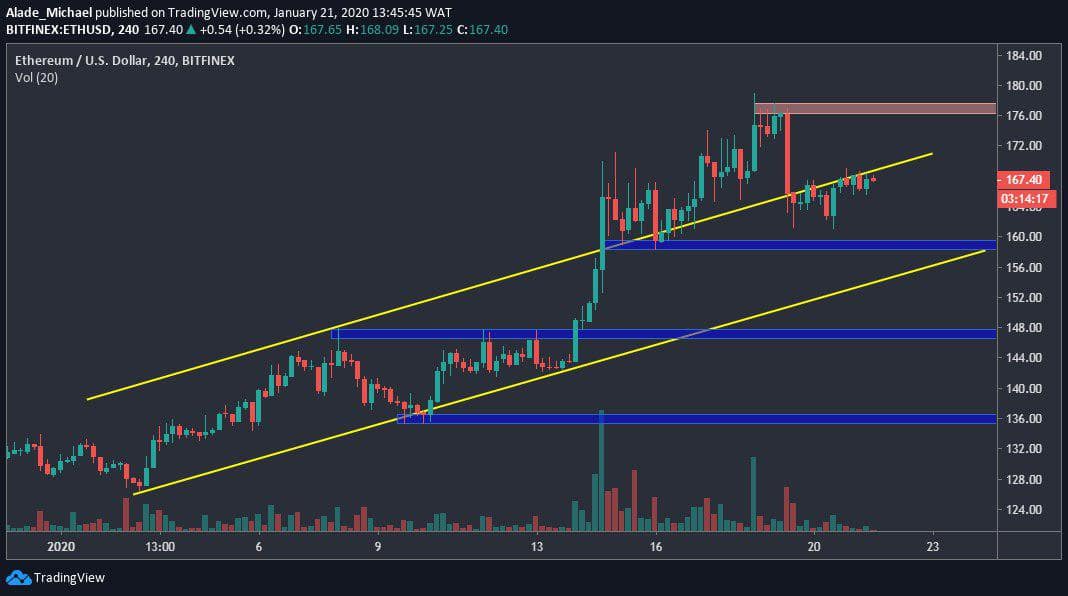
Ethereum maintained a bullish sentiment for a while now, but the sudden correction has somehow kept the market in suspense of the next rally. Following the recent correction, we can see that the forming channel pattern that got broke on January 15 is now slowly becoming valid again.
Currently, it appeared that ETH is finding it difficult to move out of this channel since the surge from last weekend. Regardless, the price is still hovering around the channel’s upper boundary.
If this channel keeps suppressing bullish actions, the price could drop to the blue support area of $159 – meeting the lower boundary of the channel. A break would send ETH to $148 and $136 support. In case Ethereum managed to reclaim $177 resistance, $188 and $200 would be the next buy targets.
Against Bitcoin, Ethereum has remained in a downward range since mid-2019. However, it has witnessed a nice increase since the beginning of the year 2020. From 0.017SAT low, the cryptocurrency is trading as high as 0.0194SAT as of the time of writing.
However, the buyers are still trapped in a bearish zone. We can expect more gains as soon as a price break occurs at 0.02SAT. Otherwise, Ethereum is most likely to resume its long-term bearish scenario. However, the short-term bullish sentiment remains valid for now.
Ethereum is trapped in a descending channel against Bitcoin. We can see that ETH price recently got rejected after touching the channel’s resistance at around 0.02SAT levels during last weekend trading, although the bulls are trying to regroup back.
If they managed to break the three-month channel to reclaim the 0.02SAT level, we could see ETH charging at 0.0218SAT and 0.0227SAT resistance levels, where the red horizontal area is drawn.
Meanwhile, a rejection at this channel’s resistance could cause a devastating drop to the 0.017SAT level, where the blue horizontal zone lies. A continuous drive lower could keep ETH price at the 0.016SAT support and beyond. Currently, buyers are still showing commitment. It’s important to wait for a channel break or bounce before joining the next major setup.