All altcoin speculators eye Ethereum’s price behavior, due to its role as the second-largest cryptocurrency and the top altcoin besides Bitcoin.
Technical Analysis By Grizzly
Key Support Levels: $1700 & $1500
Key Resistance Levels: $2200 & $2400
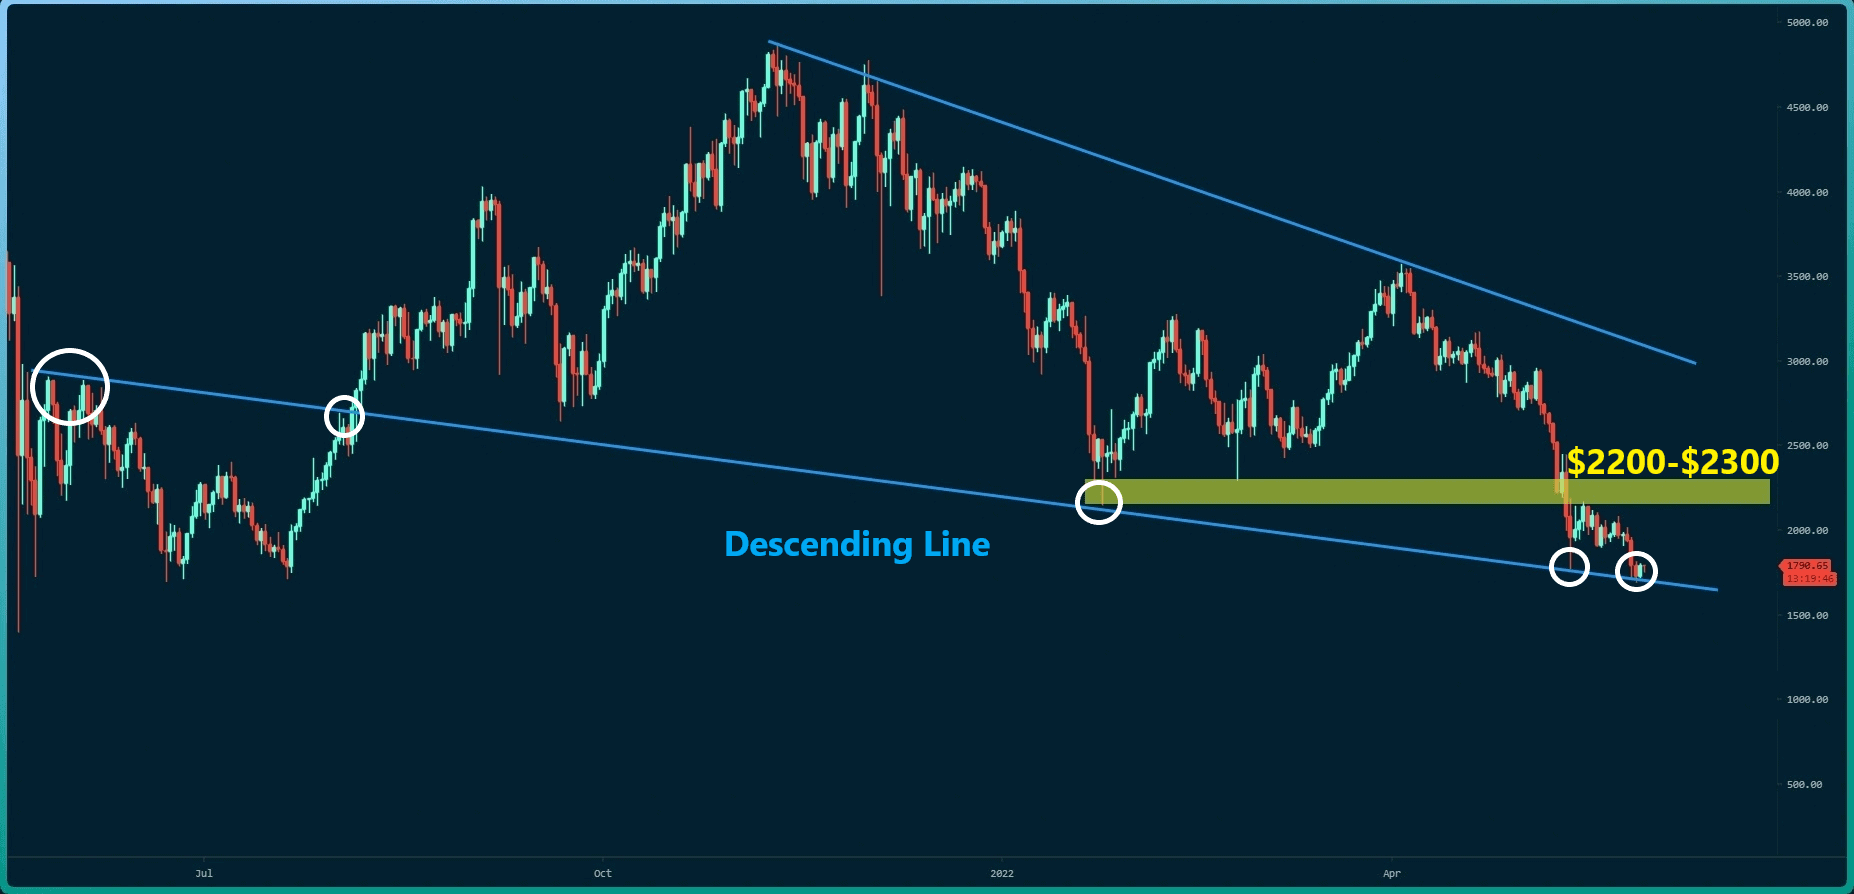
Based on the following candlestick chart, ETH is struggling at a descending line (marked blue) that has provided both support and resistance for more than a year.
It is critical that this line, which has now prevented further price drops, be maintained by ETH. Another level to keep an eye on is the range of $2200 – $2300 (marked yellow). If bulls can push the price above this level, the price is likely to move up to the upper blue line at around $3,000.
However, if sellers resume the downtrend and push the price below $1,700, we can anticipate that the demand zone in the range of $1300 – $1500 will be quickly retested in a matter of days.
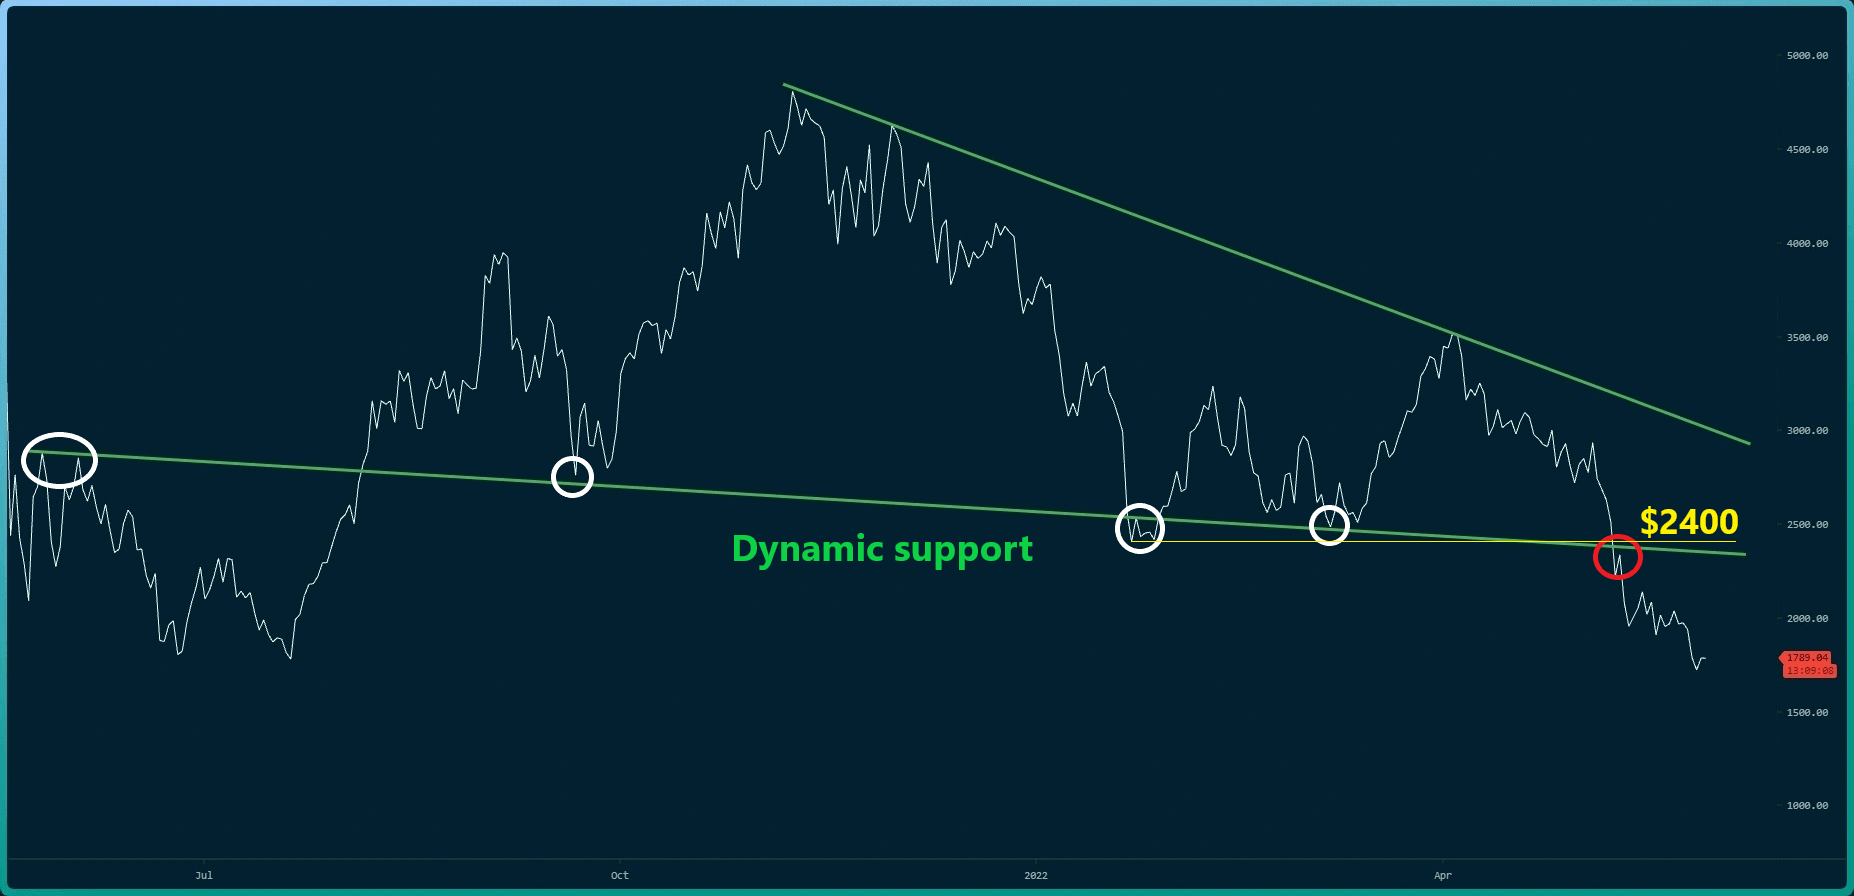
However, the situation is slightly different when looking at the following line chart: Here, the ETH price has lost the dynamic support (marked by a red circle), and the trend appears quite bearish.
As a result of the recent sharp drop, Ethereum has been unable to form higher highs and lower lows. $2400 is the key level in this chart (in yellow). Buyers should attempt to consolidate above this support, otherwise, the bearish outlook for the market will remain unchanged.
Moving Averages:
MA20: $1981
MA50: $2530
MA100: $2726
MA200: $3167
As can be seen on the following ETH/BTC pair chart, after the key level at 0.065 BTC (in yellow) was broken, the bulls could defend the horizontal support at 0.06 BTC (in green).
However, the price lost the bullish structure because a lower low was forming. The first mission for the bulls is to return to the top of the yellow resistance zone at 0.065, otherwise, the bearish trend will likely continue.
Key Support Levels: 0.060 BTC & 0.055 BTC
Key Resistance Levels: 0.065 BTC & 0.070 BTC
Definition: The total number of coins transferred.
The recent market panic had driven this indicator to its highest levels. The market volatility has not yet diminished, therefore, investors are anticipated to continue depositing coins into the exchange. Reaching a moderately calm phase in the market is only possible if this metric starts declining, which will reduce exchange inflows.