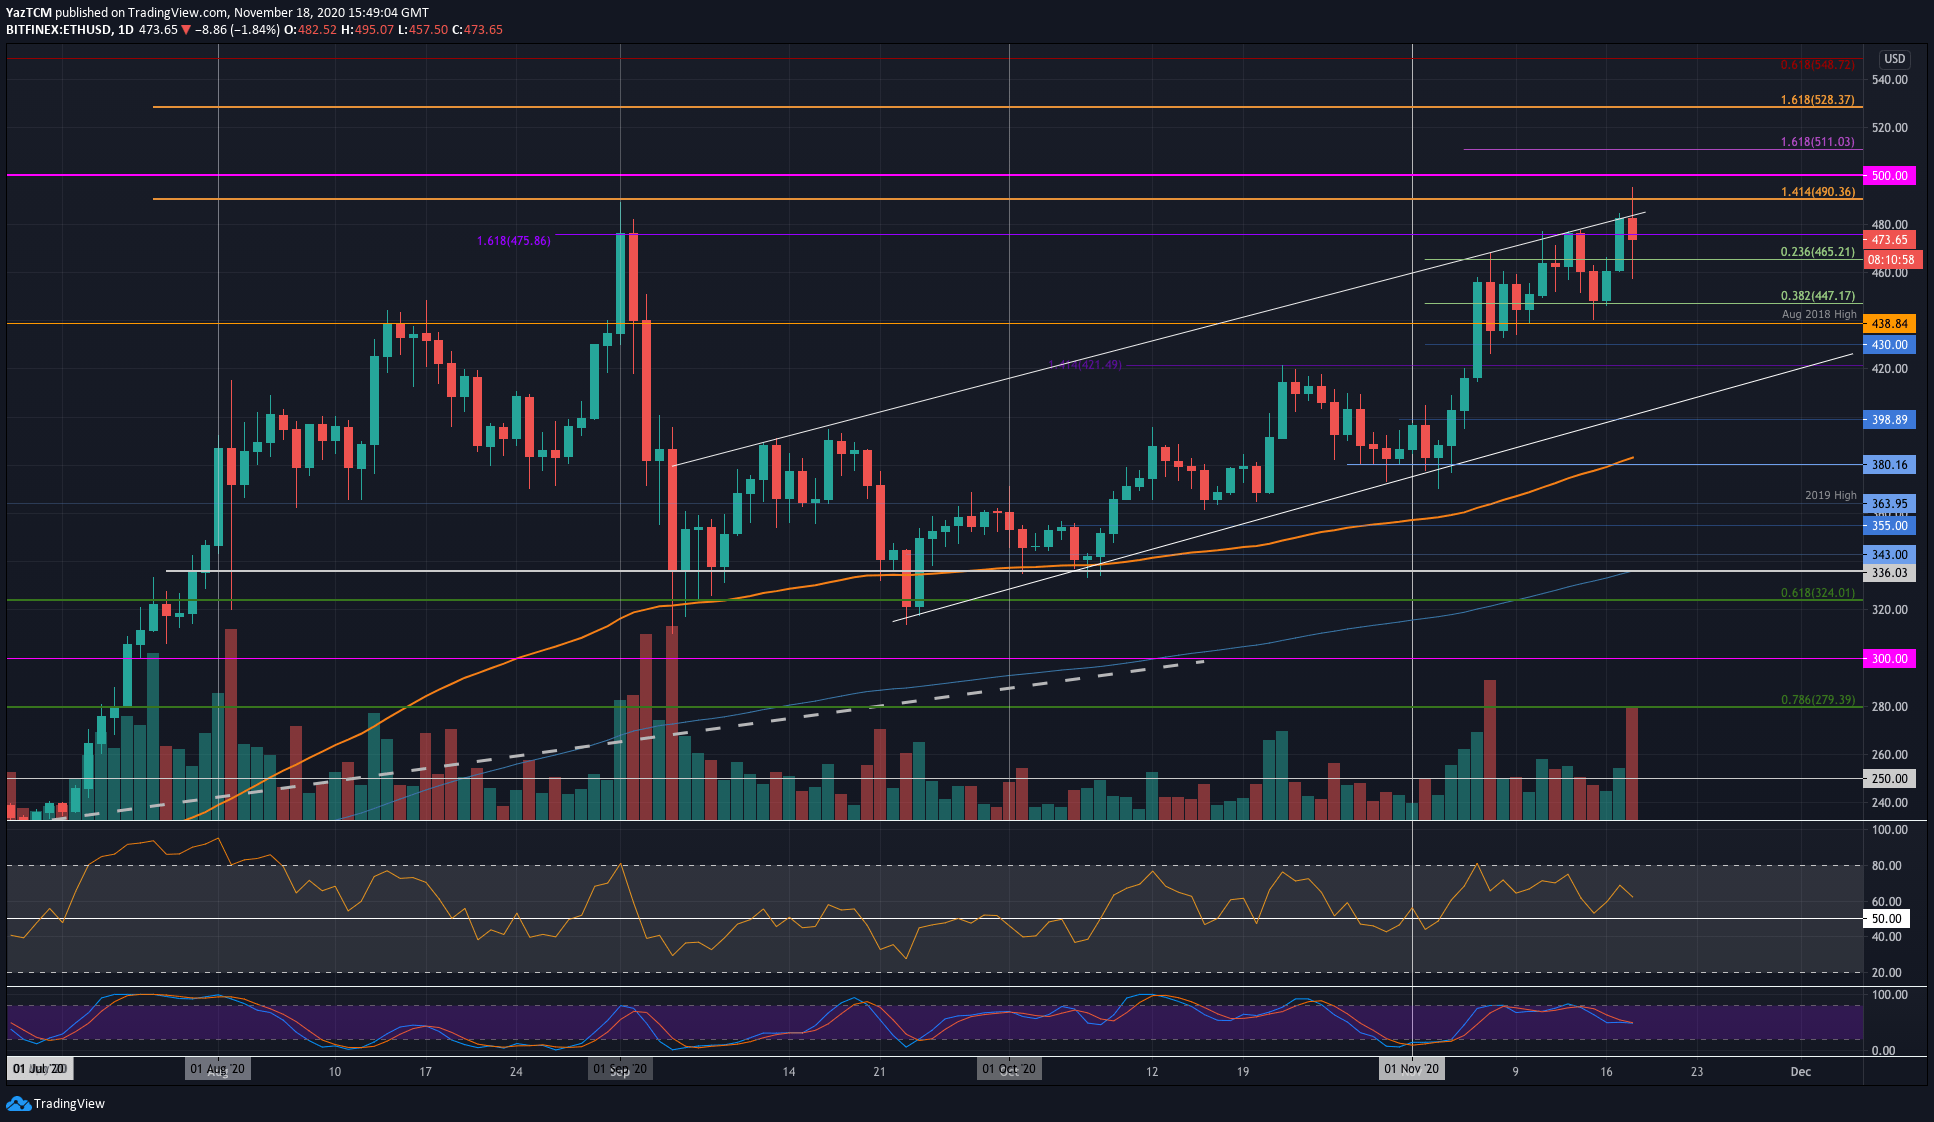
ETH/USD Daily Chart. Source: TradingView
Key Support Levels: $465, $447, $439.
Key Resistance Levels: $490, $500, $511
On Monday, Ethereum found support at the $447 level, which allowed the coin to rebound higher. From there, it pushed higher to break $475 (September high-day close) and reach the resistance at the upper boundary of the 3-month-old rising price channel.
Today, Ethereum spiked above this price channel to reach as high as $395. However, the bears have since regrouped and have pushed ETH lower to trade at $473.
Looking ahead, if the sellers continue to drive ETH lower, the first level of support lies at $465 (.236 Fib). Beneath this, support lies at $447 (.382 Fib), $439 (August 2018 High), and $430.
On the other side, if the buyers can regroup and push back above the upper boundary of this price channel, the first level of resistance lies at $490. Above this, resistance is expected at $500, $511, and $528.
Once again, there is a bearish divergence appearing between the RSI and price action. The RSI is making lower lows while the price is making higher highs. This could indicate that a sharp drop is incoming.
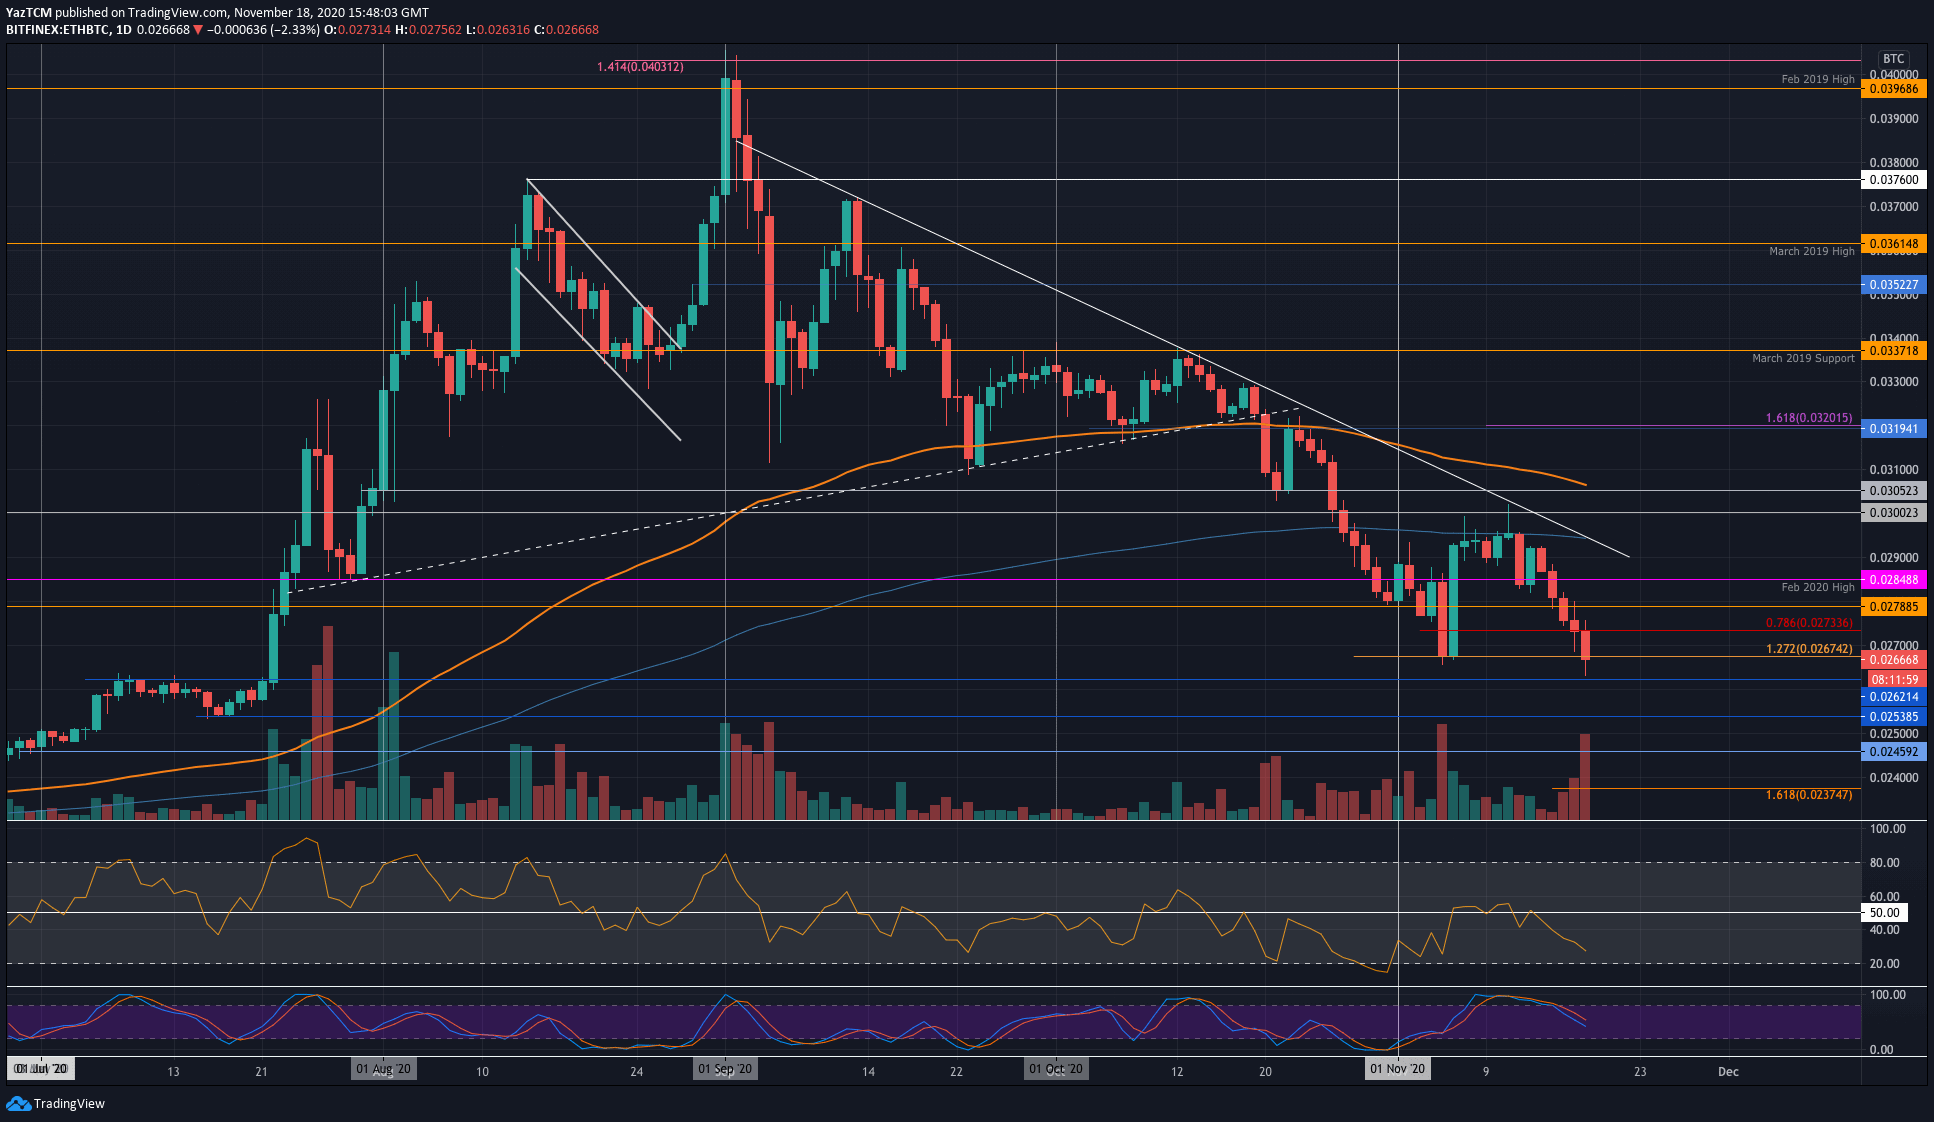
Key Support Levels: 0.0262 BTC, 0.0253 BTC, 0.025 BTC.
Key Resistance Levels: 0.0267 BTC, 0.027 BTC, 0.0278 BTC.
Against Bitcoin, Ethereum continues to struggle as it spiked beneath the support at 0.0267 BTC today to reach as low as 0.0262 BTC – putting ETH at a fresh 4-month low against BTC. The coin has been dropping in November since it failed to break the 200-days EMA earlier in the month.
If BTC continues to rally back to its ATH prices, it can be expected that ETH will continue to fall against BTC. ETH is only likely to rebound against BTC once it settles down or when the ETH 2.0 mania begins.
Looking ahead, if the sellers head lower, the first level of support lies at 0.0262 BTC. Beneath this, support lies at 0.0253 BTC, 0.025 BTC, and 0.0245 BTC.
On the other side, resistance lies at 0.0267 BTC, 0.027 BTC, 0.0278 BTC, and 0.0285 BTC (Feb 2020 Highs).
Both the RSI and Stochastic RSI are showing that the bears are in charge of the market momentum.