Ethereum has managed to rebound and remain above the rising support line which we mentioned in our previous ETH analysis. The cryptocurrency has seen a 4% price rise over the past seven days, which has allowed the price of ETH to reach over $193.
Even though ETH has remained above the trend line, the cryptocurrency looks to (still) be in a fragile position. However, if the ETH/BTC market turns bullish, we may see ETH return back above the $200 mark.
ETH remains the second-largest cryptocurrency by market value, second only to Bitcoin, with a market cap of $20.61 billion.
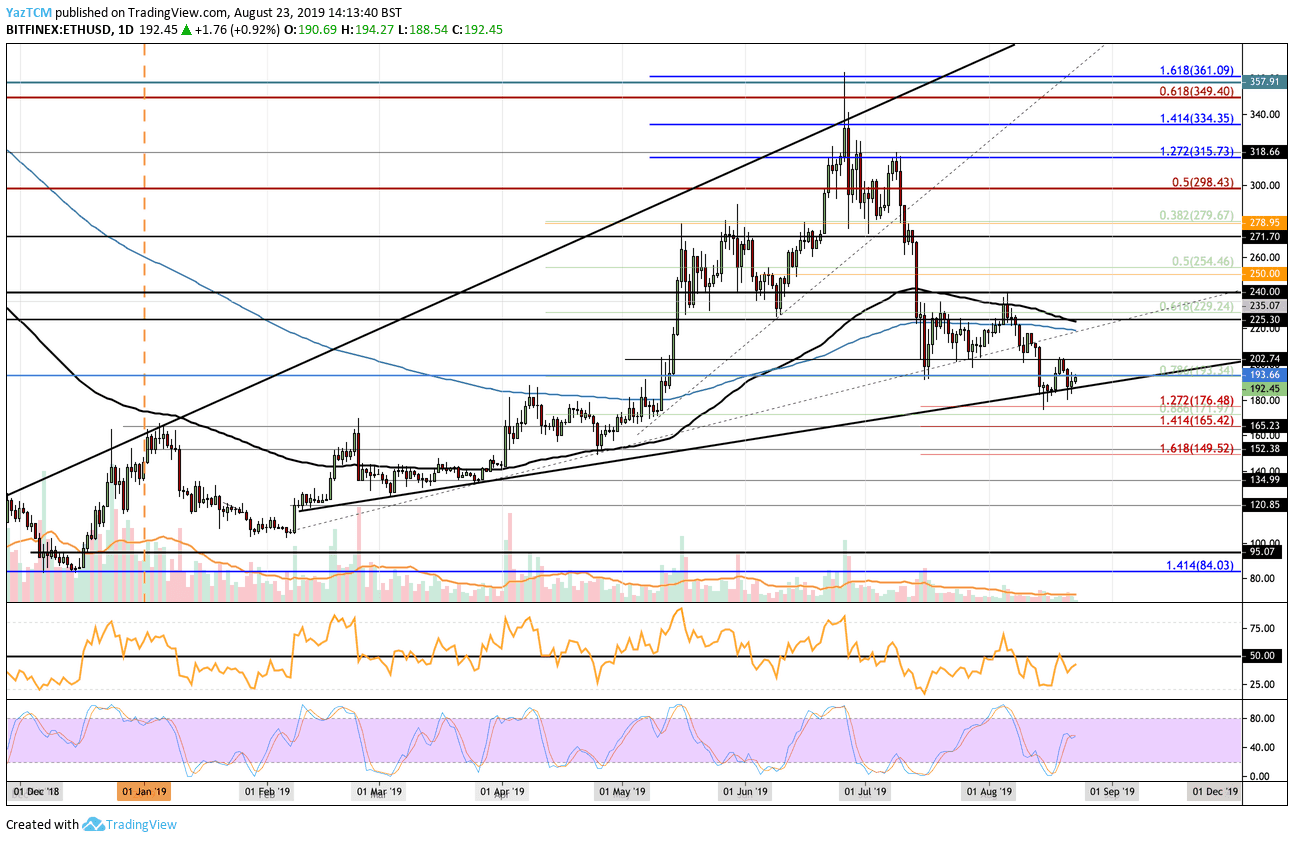
Looking at the ETH/USD 1-day chart:
- Since our previous ETH/USD analysis, ETH has continued higher after rebounding at the rising support line, but failed to overcome the resistance at $202. Ethereum has since dropped back to the support area.
- From above: If the bulls can climb back over $194, the next levels of resistance are $200 and $202. Above $202, further resistance lies between $220 and $225, which are the 200- and 100-day EMAs, respectively. Above this, higher resistance lies at $229, $235, $240, $250 and $271.
- From below: The nearest level of support lies at the rising support trend line. If the sellers break beneath this trend line, we can expect support toward the downside at $190 and $180. Beneath $180, further support lies at $176.48, $165.42 and $150.
- The trading volume remains at about the average level.
- The RSI has been rising but remains beneath 50. If the RSI can climb back above 50, this will be a sign that the ETH price might stay above the rising support line.
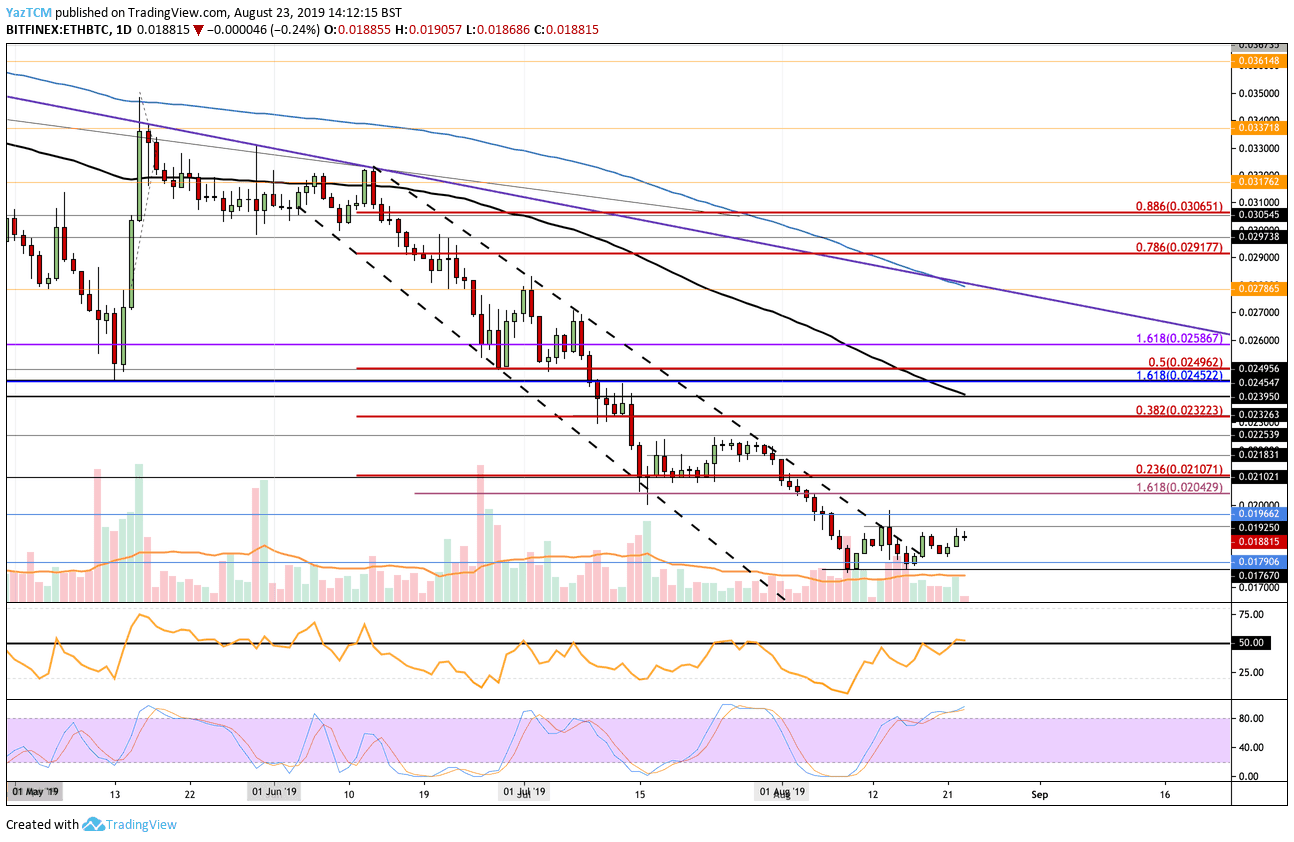
Looking at the ETH/BTC 1-day chart:
- Ethereum has continued to trade sideways against BTC after rebounding around 0.0176 BTC. The cryptocurrency has now established a trading range between 0.01925 BTC and 0.0176 BTC.
- From above: The nearest level of resistance lies at the upper boundary of the range. Above this, higher resistance lies at 0.01966 BTC and 0.02 BTC. If the bulls can continue above 0.02 BTC, the next resistance levels are 0.0204 BTC, 0.021 BTC, 0.02183 BTC, and 0.02322 BTC.
- From below: The nearest level of support is 0.018 BTC. Beneath this, further support can be found at 0.0179 BTC and 0.0176 BTC (the lower boundary of the trading range).
- The trading volume has remained quite low during this period of sideways movement.
- The RSI recently poked above 50, which is a promising sign for the bulls. However, the Stochastic RSI is currently overbought and is about to produce a bearish crossover signal which could stall the ETH/BTC ascension.
SPECIAL OFFER (Sponsored)
LIMITED OFFER 2024 for CryptoPotato readers at Bybit: Use this link to register and open a $500 BTC-USDT position on Bybit Exchange for free!
Disclaimer: Information found on CryptoPotato is those of writers quoted. It does not represent the opinions of CryptoPotato on whether to buy, sell, or hold any investments. You are advised to conduct your own research before making any investment decisions. Use provided information at your own risk. See Disclaimer for more information.
Cryptocurrency charts by TradingView.