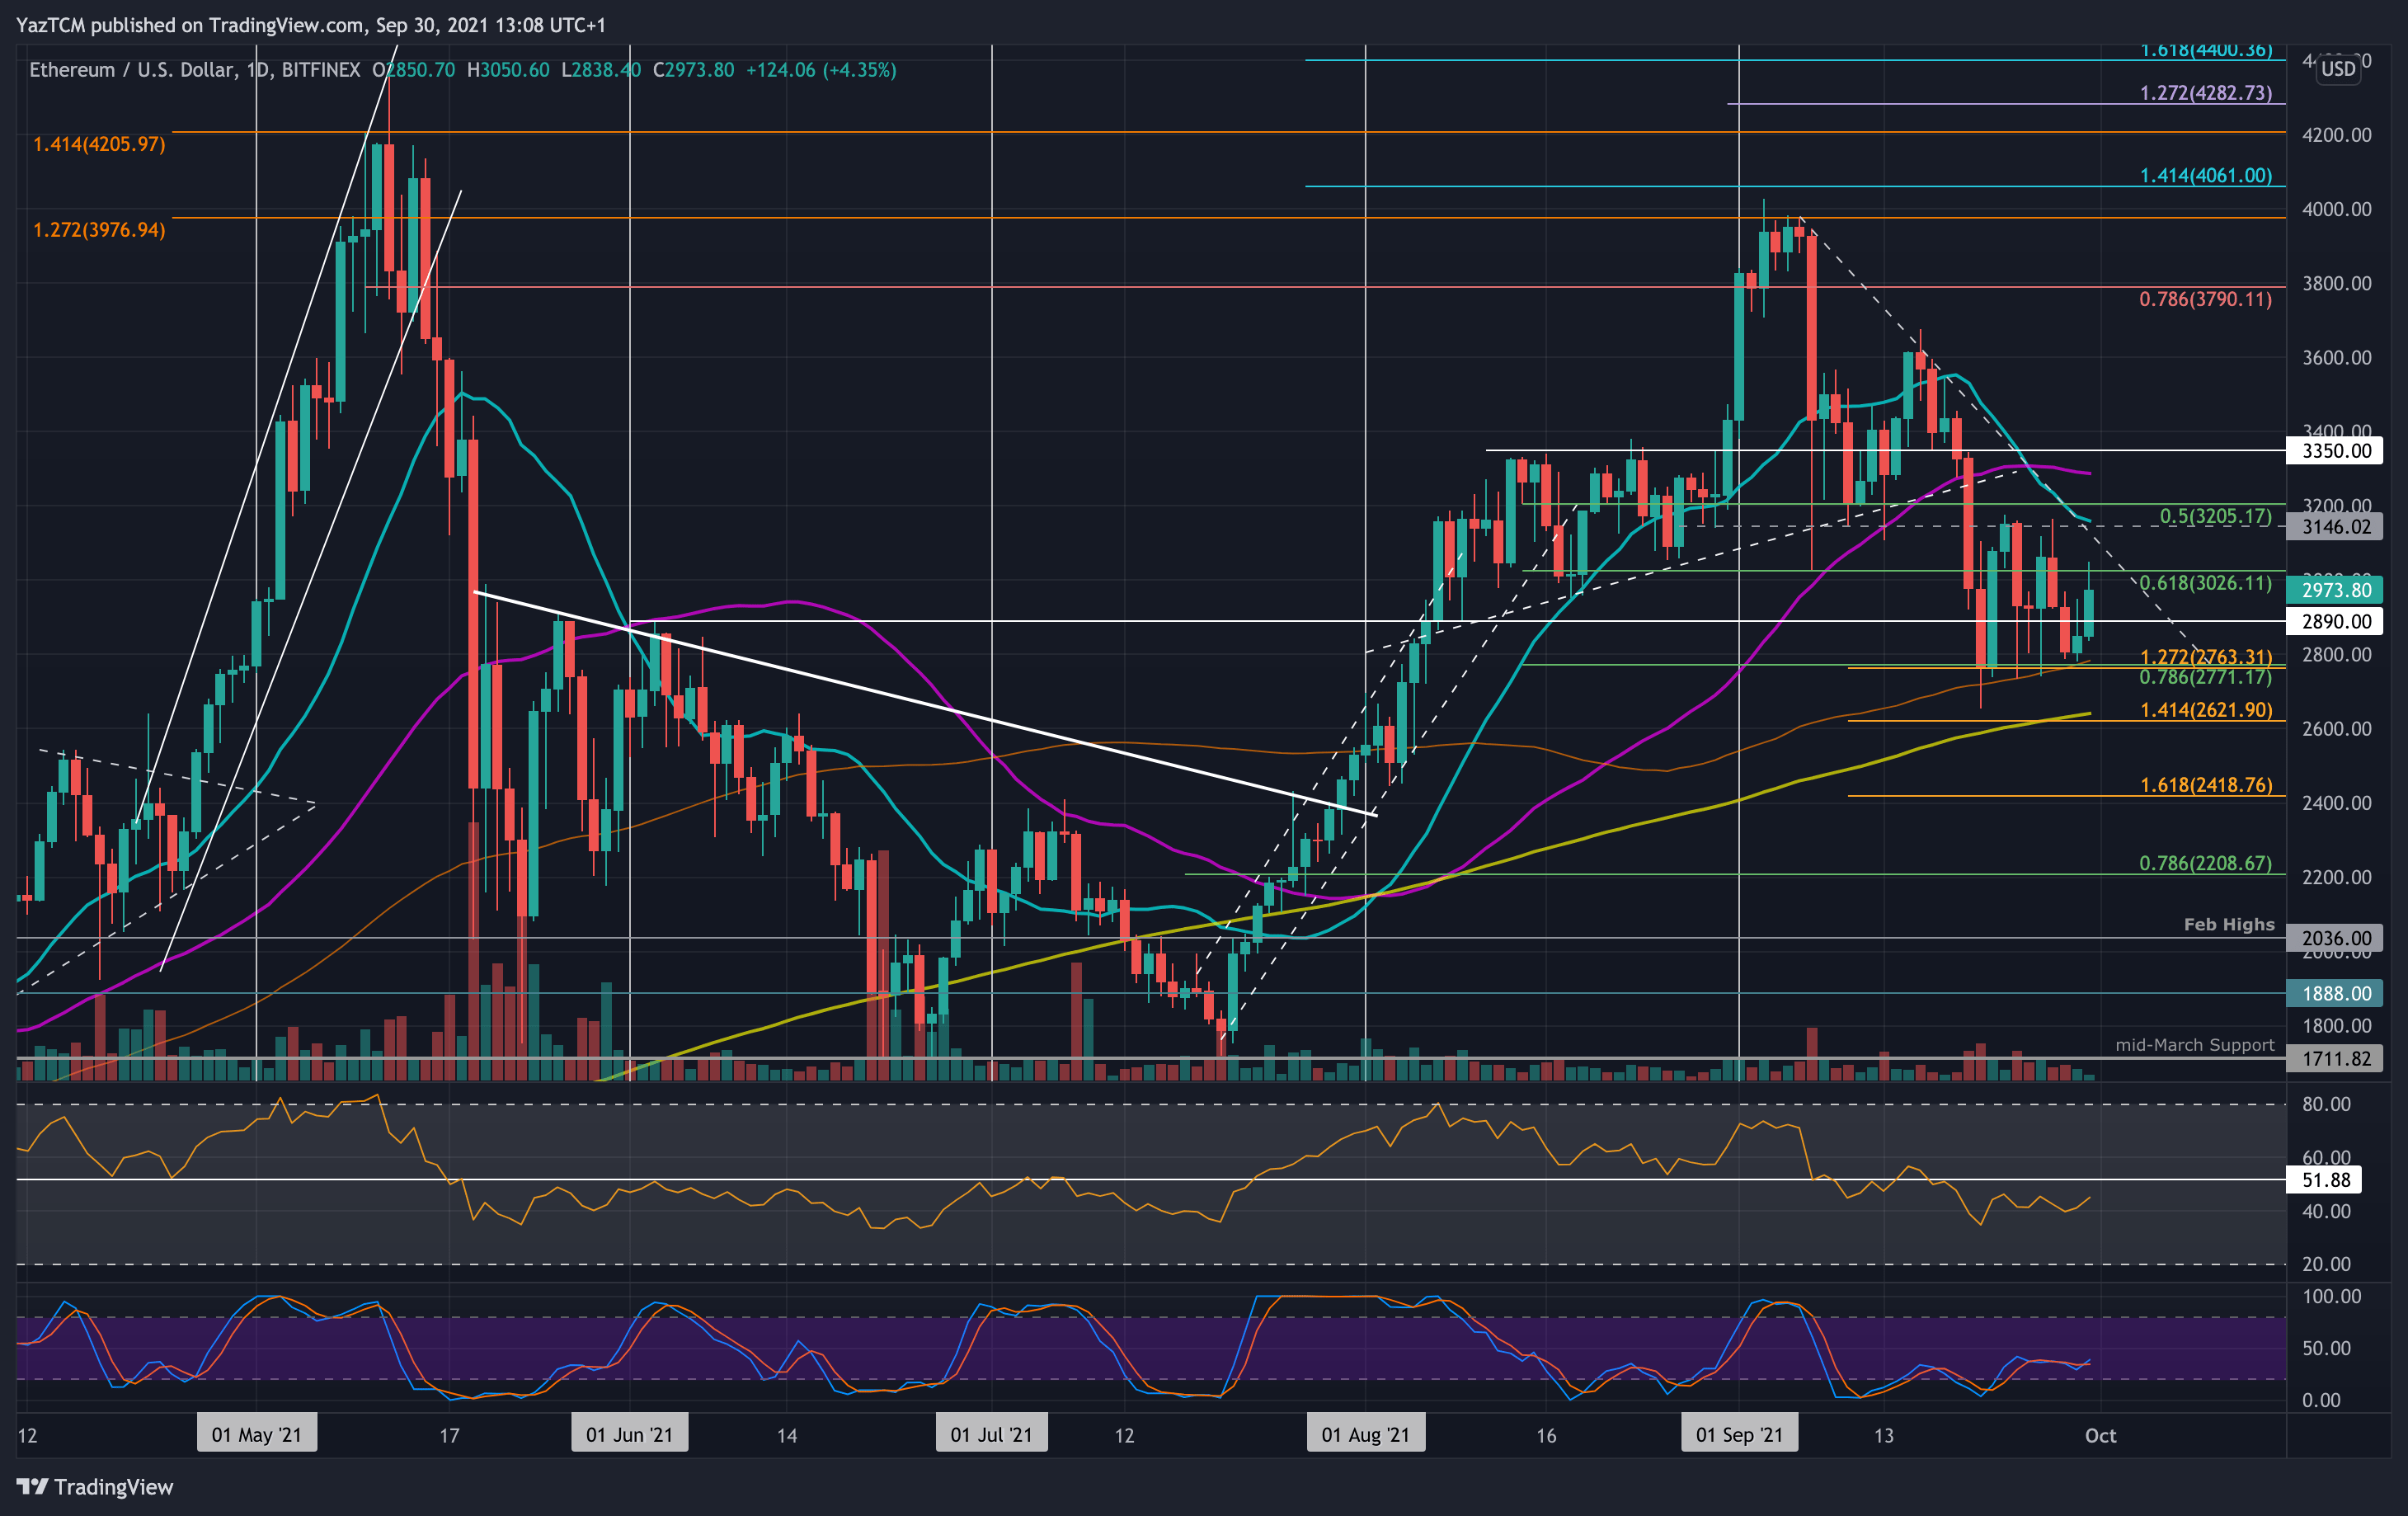
ETH/USD Daily Chart. Source: TradingView.
Key Support Levels: $2890, $2710, $2620.
Key Resistance Levels: $3000, $3200, $3300.
Etheruem continues to trade inside the range it set around ten days ago between $3200 and support at $2770 (.786 Fib). A 100-day MA further bolsters the support at the bottom end of the range.
Yesterday, ETH found the support at $2800 and rebounded higher from there today as it spikes above $3000. The market will need to break this established range to dictate the next direction. A break above $3200 could allow ETH to recover to the September highs. On the other hand, if it goes below $2,800 we might see the cryptocurrency start sliding to $2.2K.
Looking ahead, the first support lies at $2890. This is followed by $2710 (.786 Fib & 100-day MA), $2620 (200-day MA & downside 1.414 Fib Extension), and $2500.
On the other side, the first resistance lies at $3000. This is followed by $3200 (20-day MA), $3300 (50-day MA), $3350, and $3500.
The daily RSI remains beneath the midline, indicating weak bearish momentum in the market. However, it is shaping up to hold 40 and is looking to climb back into bullish territory.
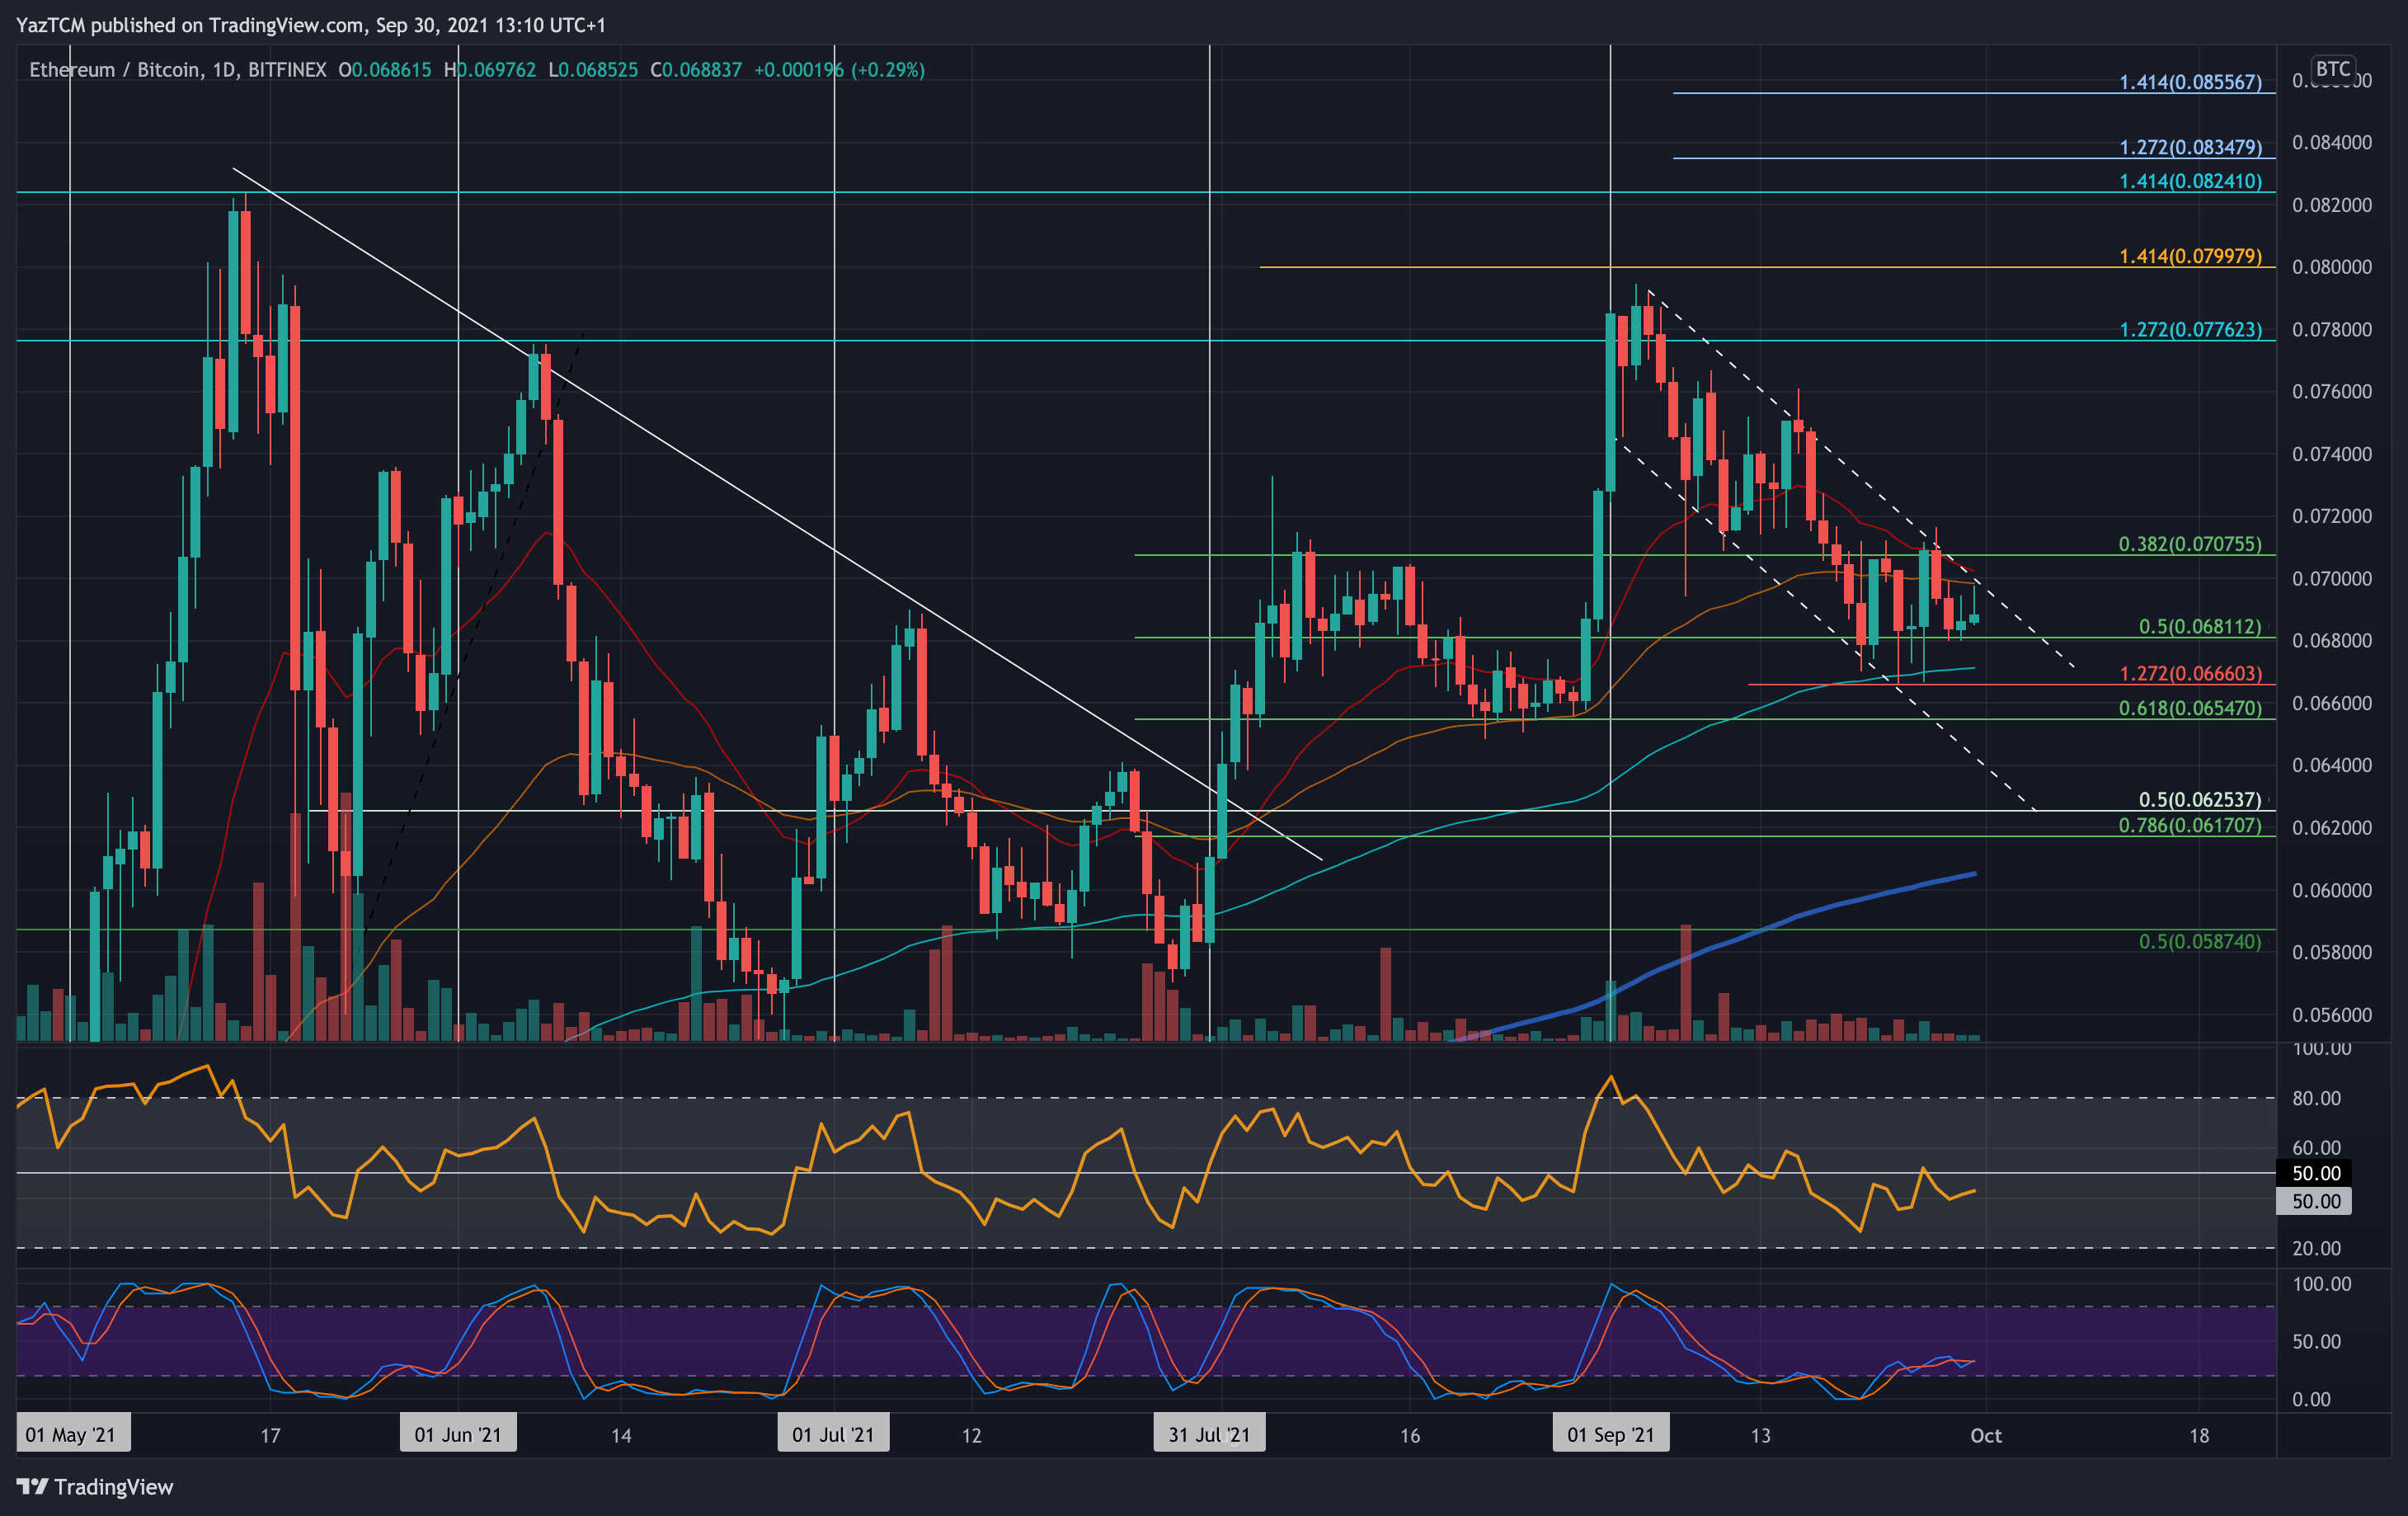
Key Support Levels: 0.068 BTC, 0.0671 BTC, 0.066 BTC.
Key Resistance Levels: 0.07 BTC, 0.072 BTC, 0.074 BTC.
Against BTC, the cryptocurrency is doing well to hold the support at 0.068 BTC, provided by a .5 Fib Retracement. ETH has also been trapped inside a range between the support at 0.068 BTC and resistance at 0.071 BTC. It must break this range to trend in the next direction.
Additionally, ETH is also trading inside a descending price channel here. It recently found resistance at the upper boundary of the price channel at the start of the week, which caused it to head back toward the 0.068 BTC support.
Moving forward, the first support lies at 0.068 BTC (.5 Fib). This is followed by 0.0671 BTC (20-day MA), 0.066 BTC (downside 1.272 Fib Extension), and 0.0654 BTC (.618 Fib).
On the other side, the first resistance lies at 0.07 BTC (100-day MA). This is followed by 0.072 BTC, 0.074 BTC, and 0.075 BTC.
Again, the RSI remains beneath the midline, indicating weak bearish momentum controls the price.