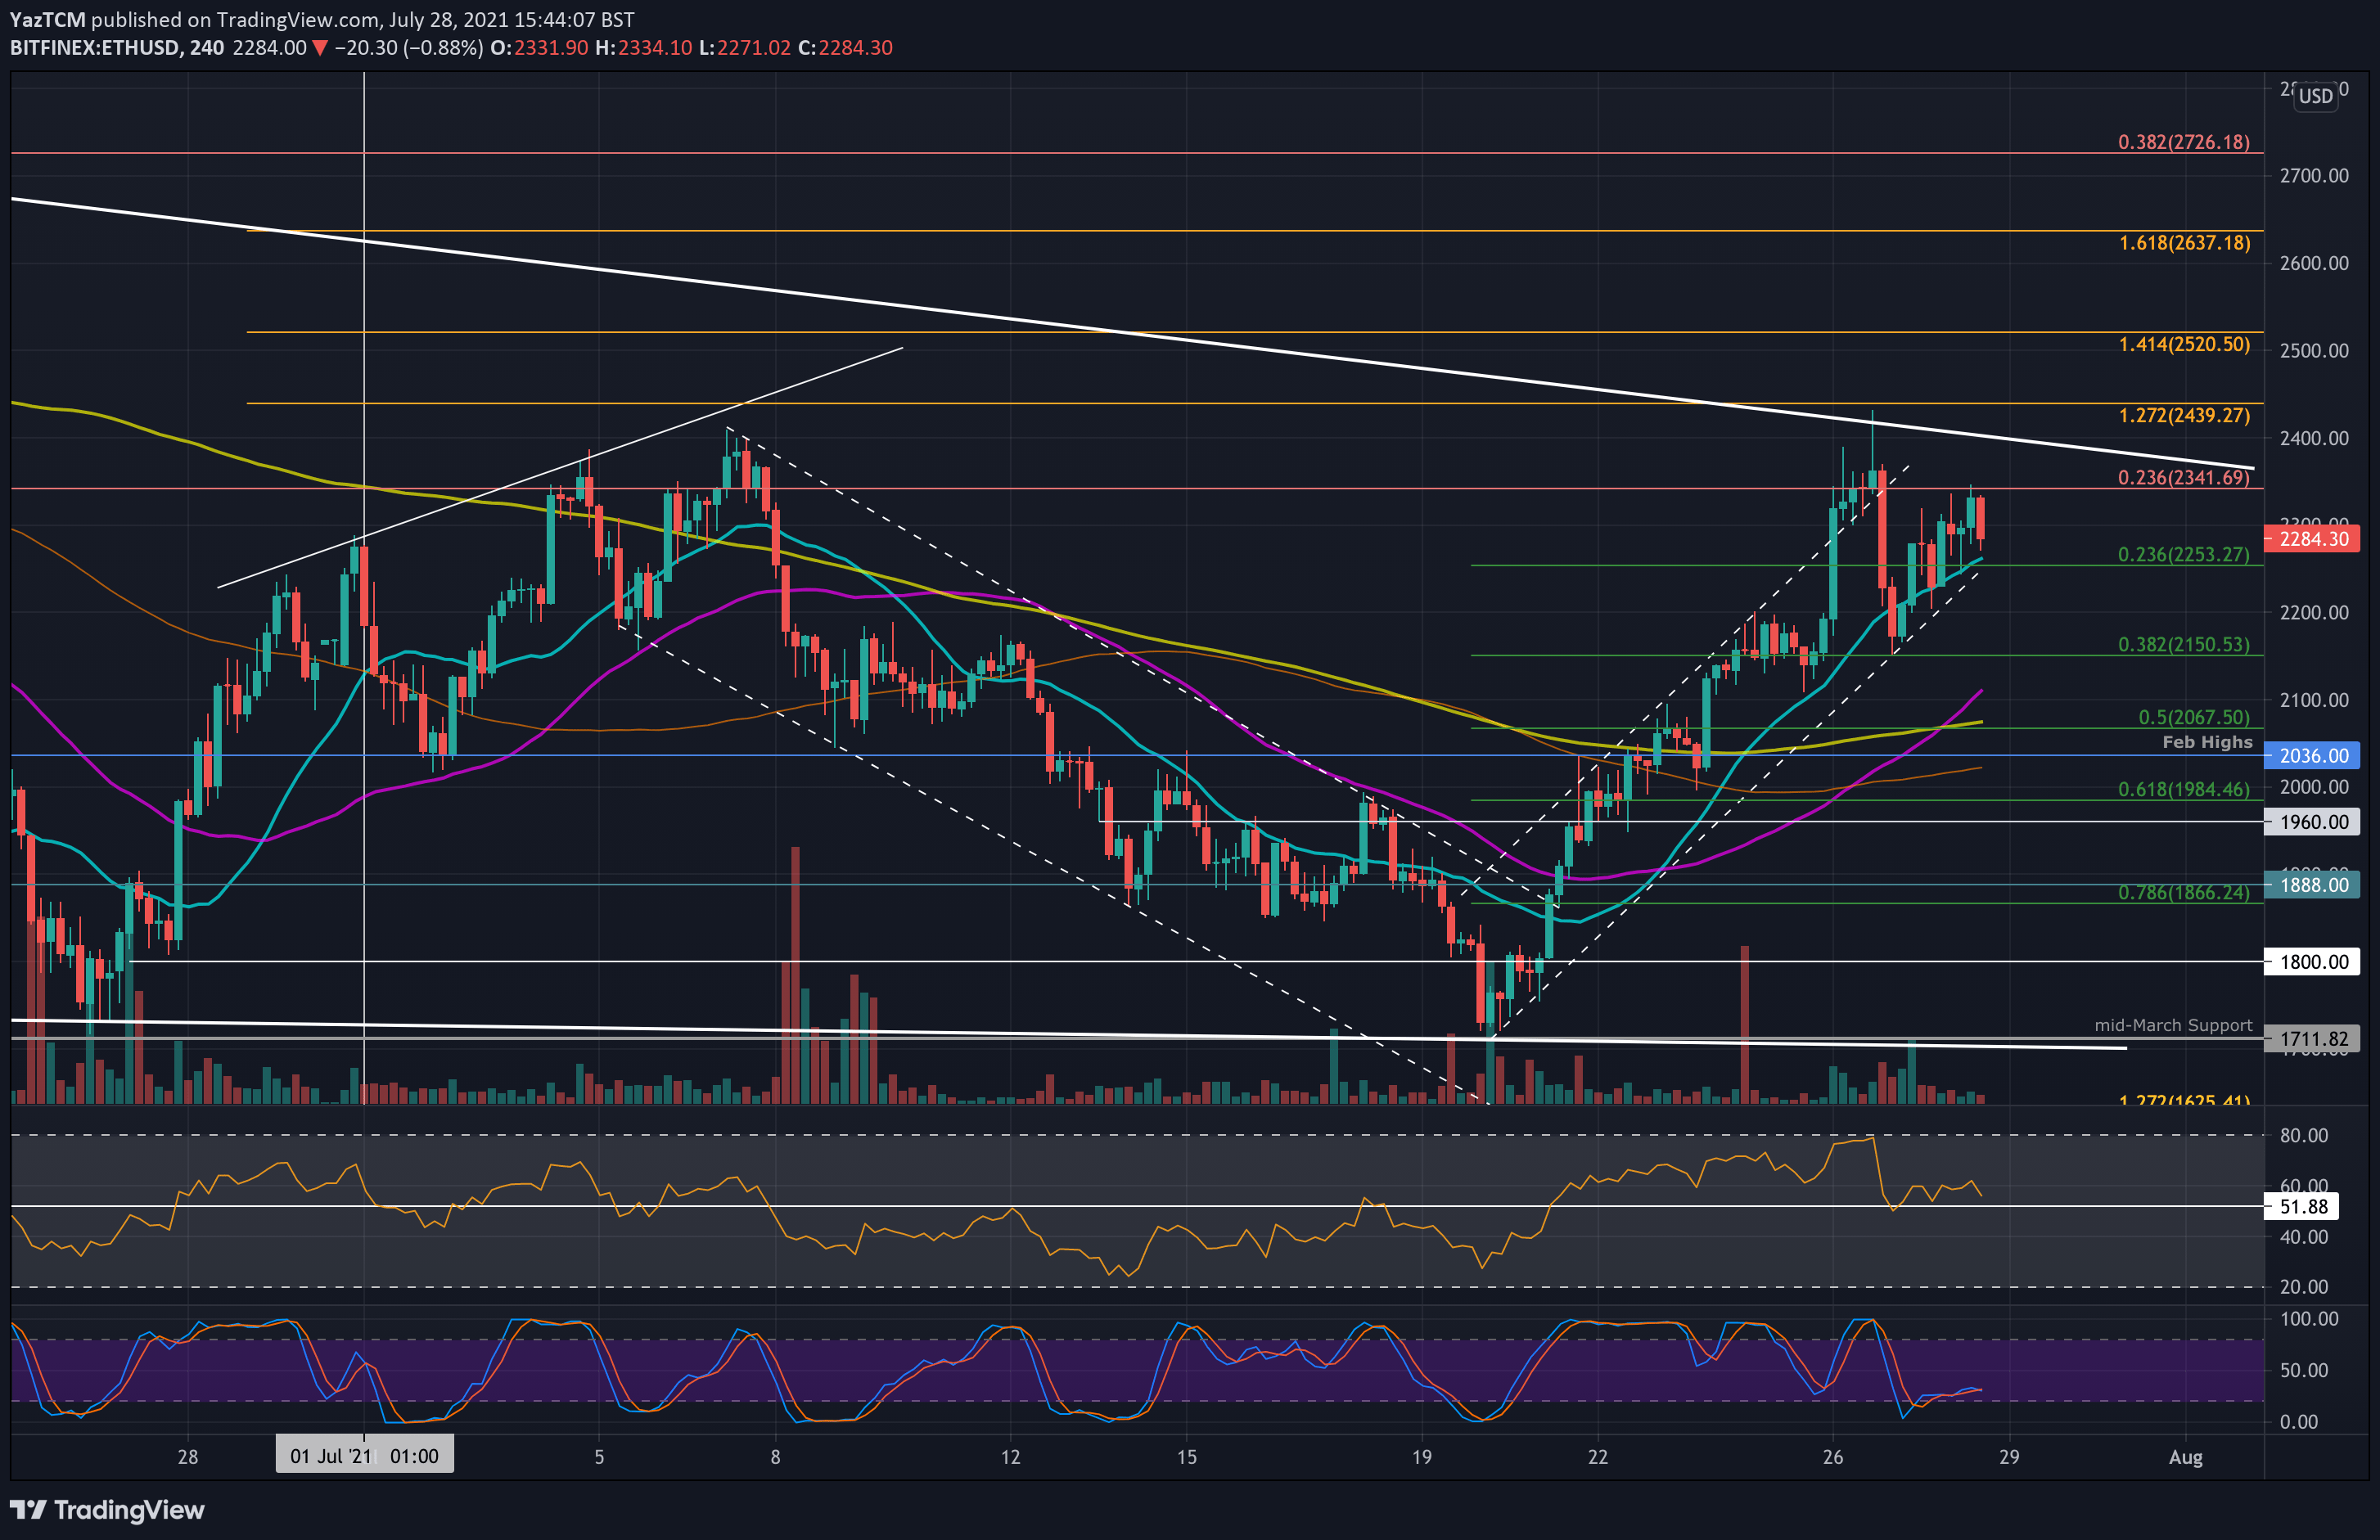
ETH/USD 4-Hour Chart. Source: TradingView.
Key Support Levels: $2250, $2150 – $2130, $2070.
Key Resistance Levels: $2340, $2400, $2530.
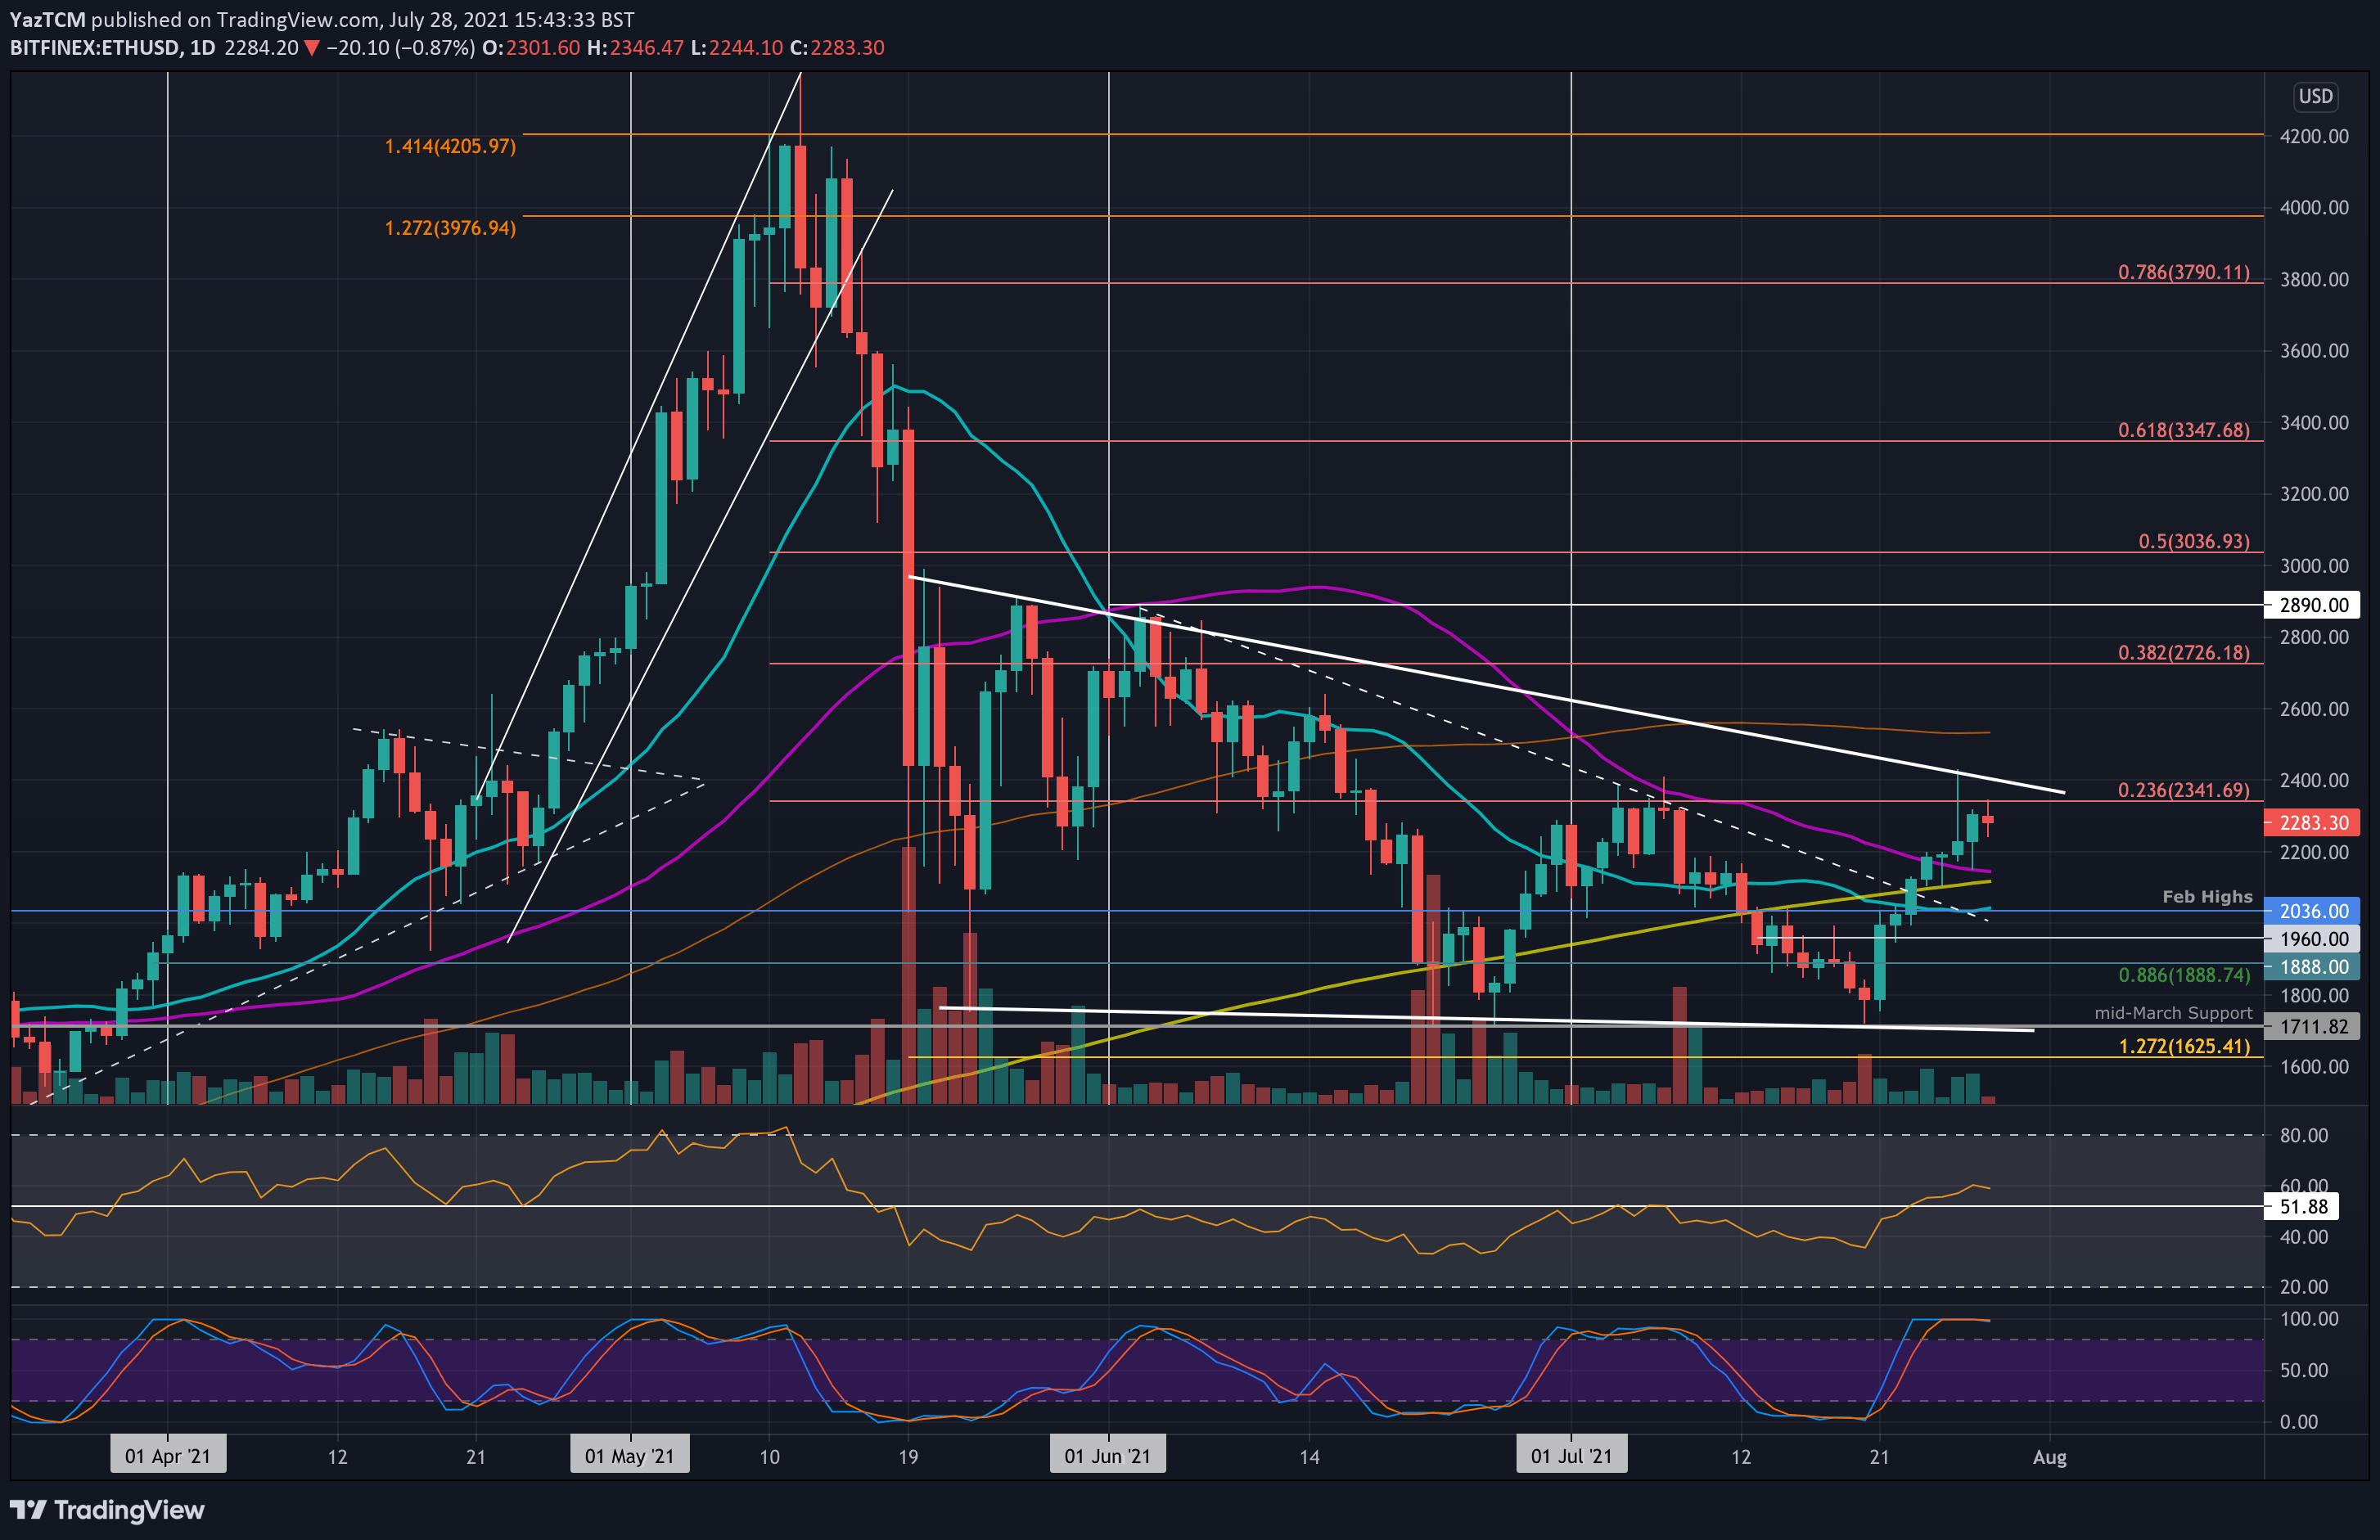
Ethereum is surging on the back of BTC rising almost 30% this week. The cryptocurrency managed to break the 50-day MA over the weekend and continued higher from hitting resistance at a descending trend line on Monday.
Since then, ETH has struggled to break resistance at around $2340, provided by a bearish .236 Fib Retracement level. This is the July resistance, and a candle must close above it on the daily chart to signal a potential bull run ahead.
On the 4-hour chart, ETH is trading inside a short-term ascending price channel. It is using the lower angle of this price channel as local support.
Looking ahead, the first strong resistance lies at $2340 (bearish .236 Fib). This is followed by $2400, provided by the descending trend line. Added resistance lies at $2530 (200-day MA), $2600, and $2640 (1.618 Fib Extension).
On the other side, the first support lies at $2250 (.236 Fib & lower angle of price channel). This is followed by support between $2150 (50-day MA & .382 Fib) – $2130 (200-day MA), and $2070 (.5 Fib).
The daily RSI is above the midline, indicating bullish momentum. It is struggling to break 60 and must rise past here to show increasing bullish momentum.
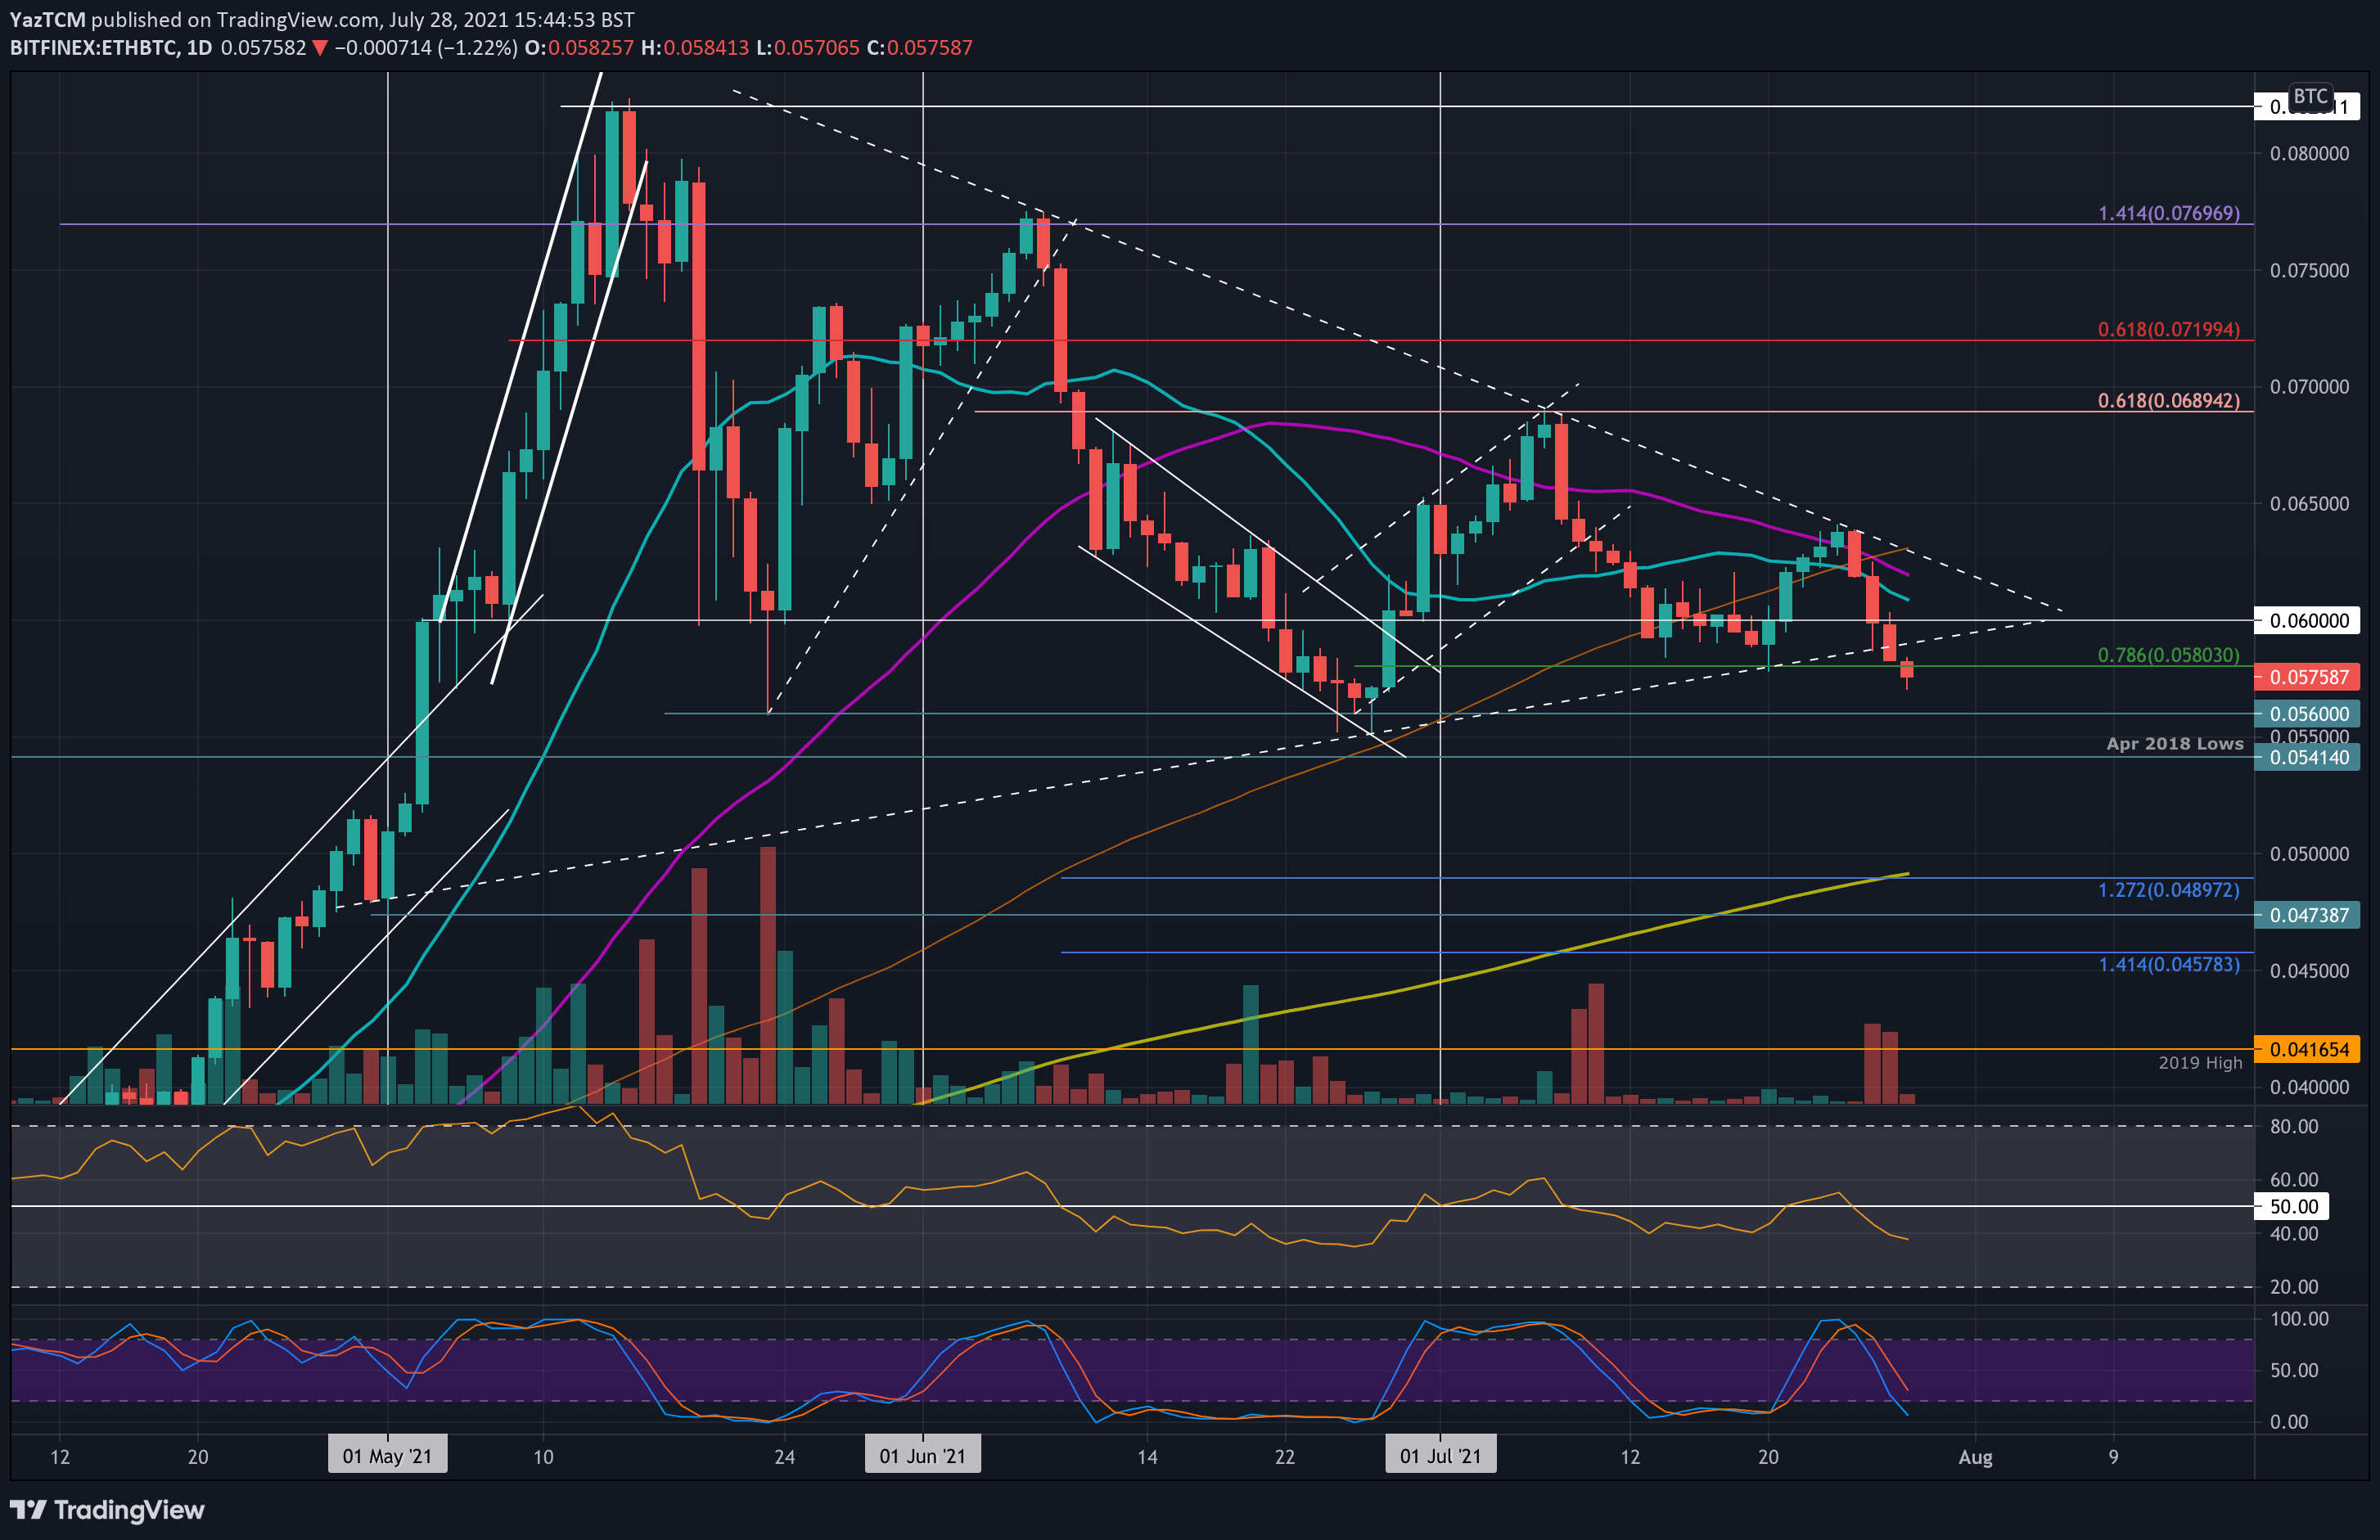
Key Support Levels: 0.056 BTC, 0.0541 BTC, 0.05 BTC.
Key Resistance Levels: 0.06 BTC, 0.062 BTC, 0.0631 BTC.
ETH is struggling against BTC itself after setting a new low for July at 0.057 BTC today. The cryptocurrency was previously trading inside a symmetrical triangle pattern but was rejected at the triangle’s upper boundary at the start of the week.
Since then, ETH has been falling against BTC and eventually broke toward the downside of the triangle yesterday. Today, it continued beneath support at 0.058 BTC to set the new July low at 0.057 BTC.
Moving forward, the first support now lies at 0.056 BTC. This is followed by 0.0541 BTC (April 2019 lows), 0.05 BTC, and 0.049 BTC (200-day MA).
On the other side, the first strong resistance lies at 0.06 BTC. This is followed by 0.062 BTC (50-day MA), 0.0631 BTC (100-day MA), and 0.065 BTC.
The daily RSI is sinking beneath 40 as the bearish momentum increases. This is not a good signal for ETH.