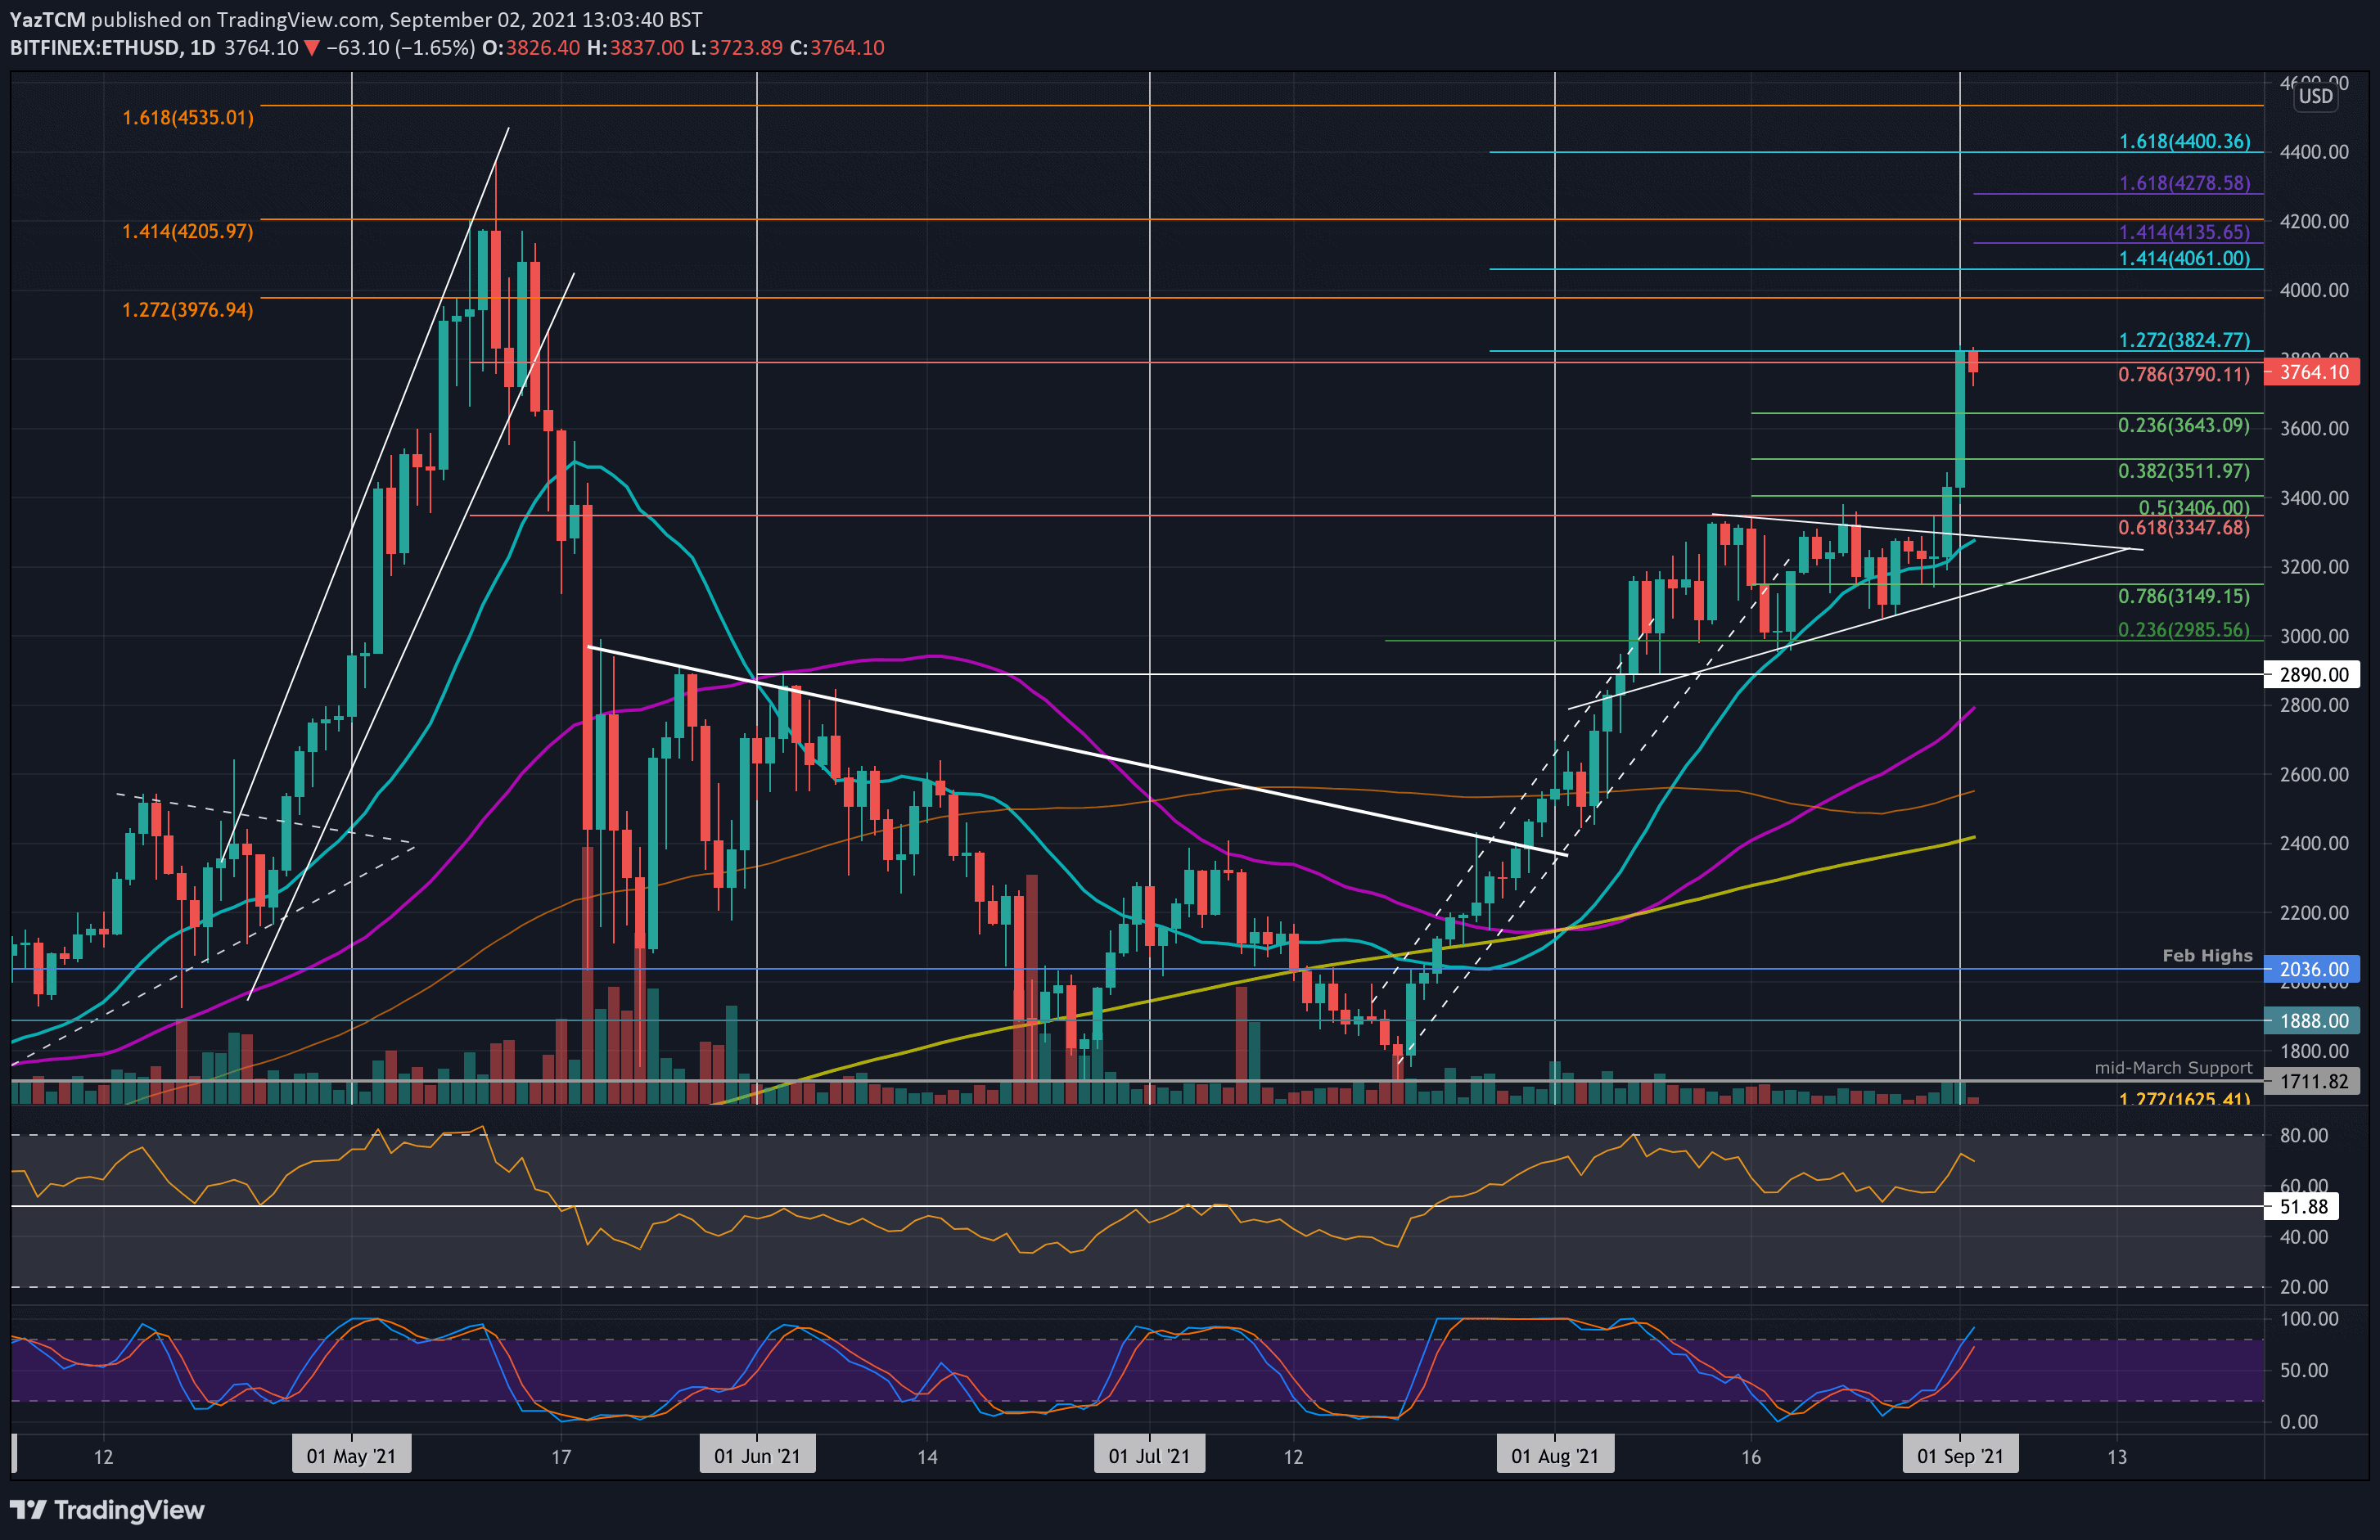
ETH/USD Daily Chart. Source: TradingView.
Key Support Levels: $3640, $3510, $3400.
Key Resistance Levels: $3825, $4000, $4060.
Ethereum penetrated the consolidation pattern this week, which was in play since mid-August when the coin failed to break resistance at $3350. This resulted in it forming a symmetrical triangle pattern for the second half of August and gaining about 17% in a week.
On Tuesday, ETH bounced from the 20-day MA and broke above the symmetrical triangle. It then continued to break the August resistance at $3350 (bearish .618 Fib) to climb above $3400.
It went higher yesterday as it surged from $3400 to reach higher $3825 (1.272 Fib Extension). It has since dropped from the high and is trading around $3765.
Looking ahead, if the bulls break $3825 (1.272 Fib Extension), the first resistance lies at $4000. This is followed by $4060 (1.414 Fib Extension), $4200 (1.414 Fib Extension – orange), $4280 (1.618 Fib Extension – purple), and $4400.
On the other side, the first support lies at $3640 (.236 Fib). This is followed by $3510 (.382 Fib), $3400 (.5 Fib), and $3300 (20-day MA).
The RSI is now also rising as the bullish momentum increases.
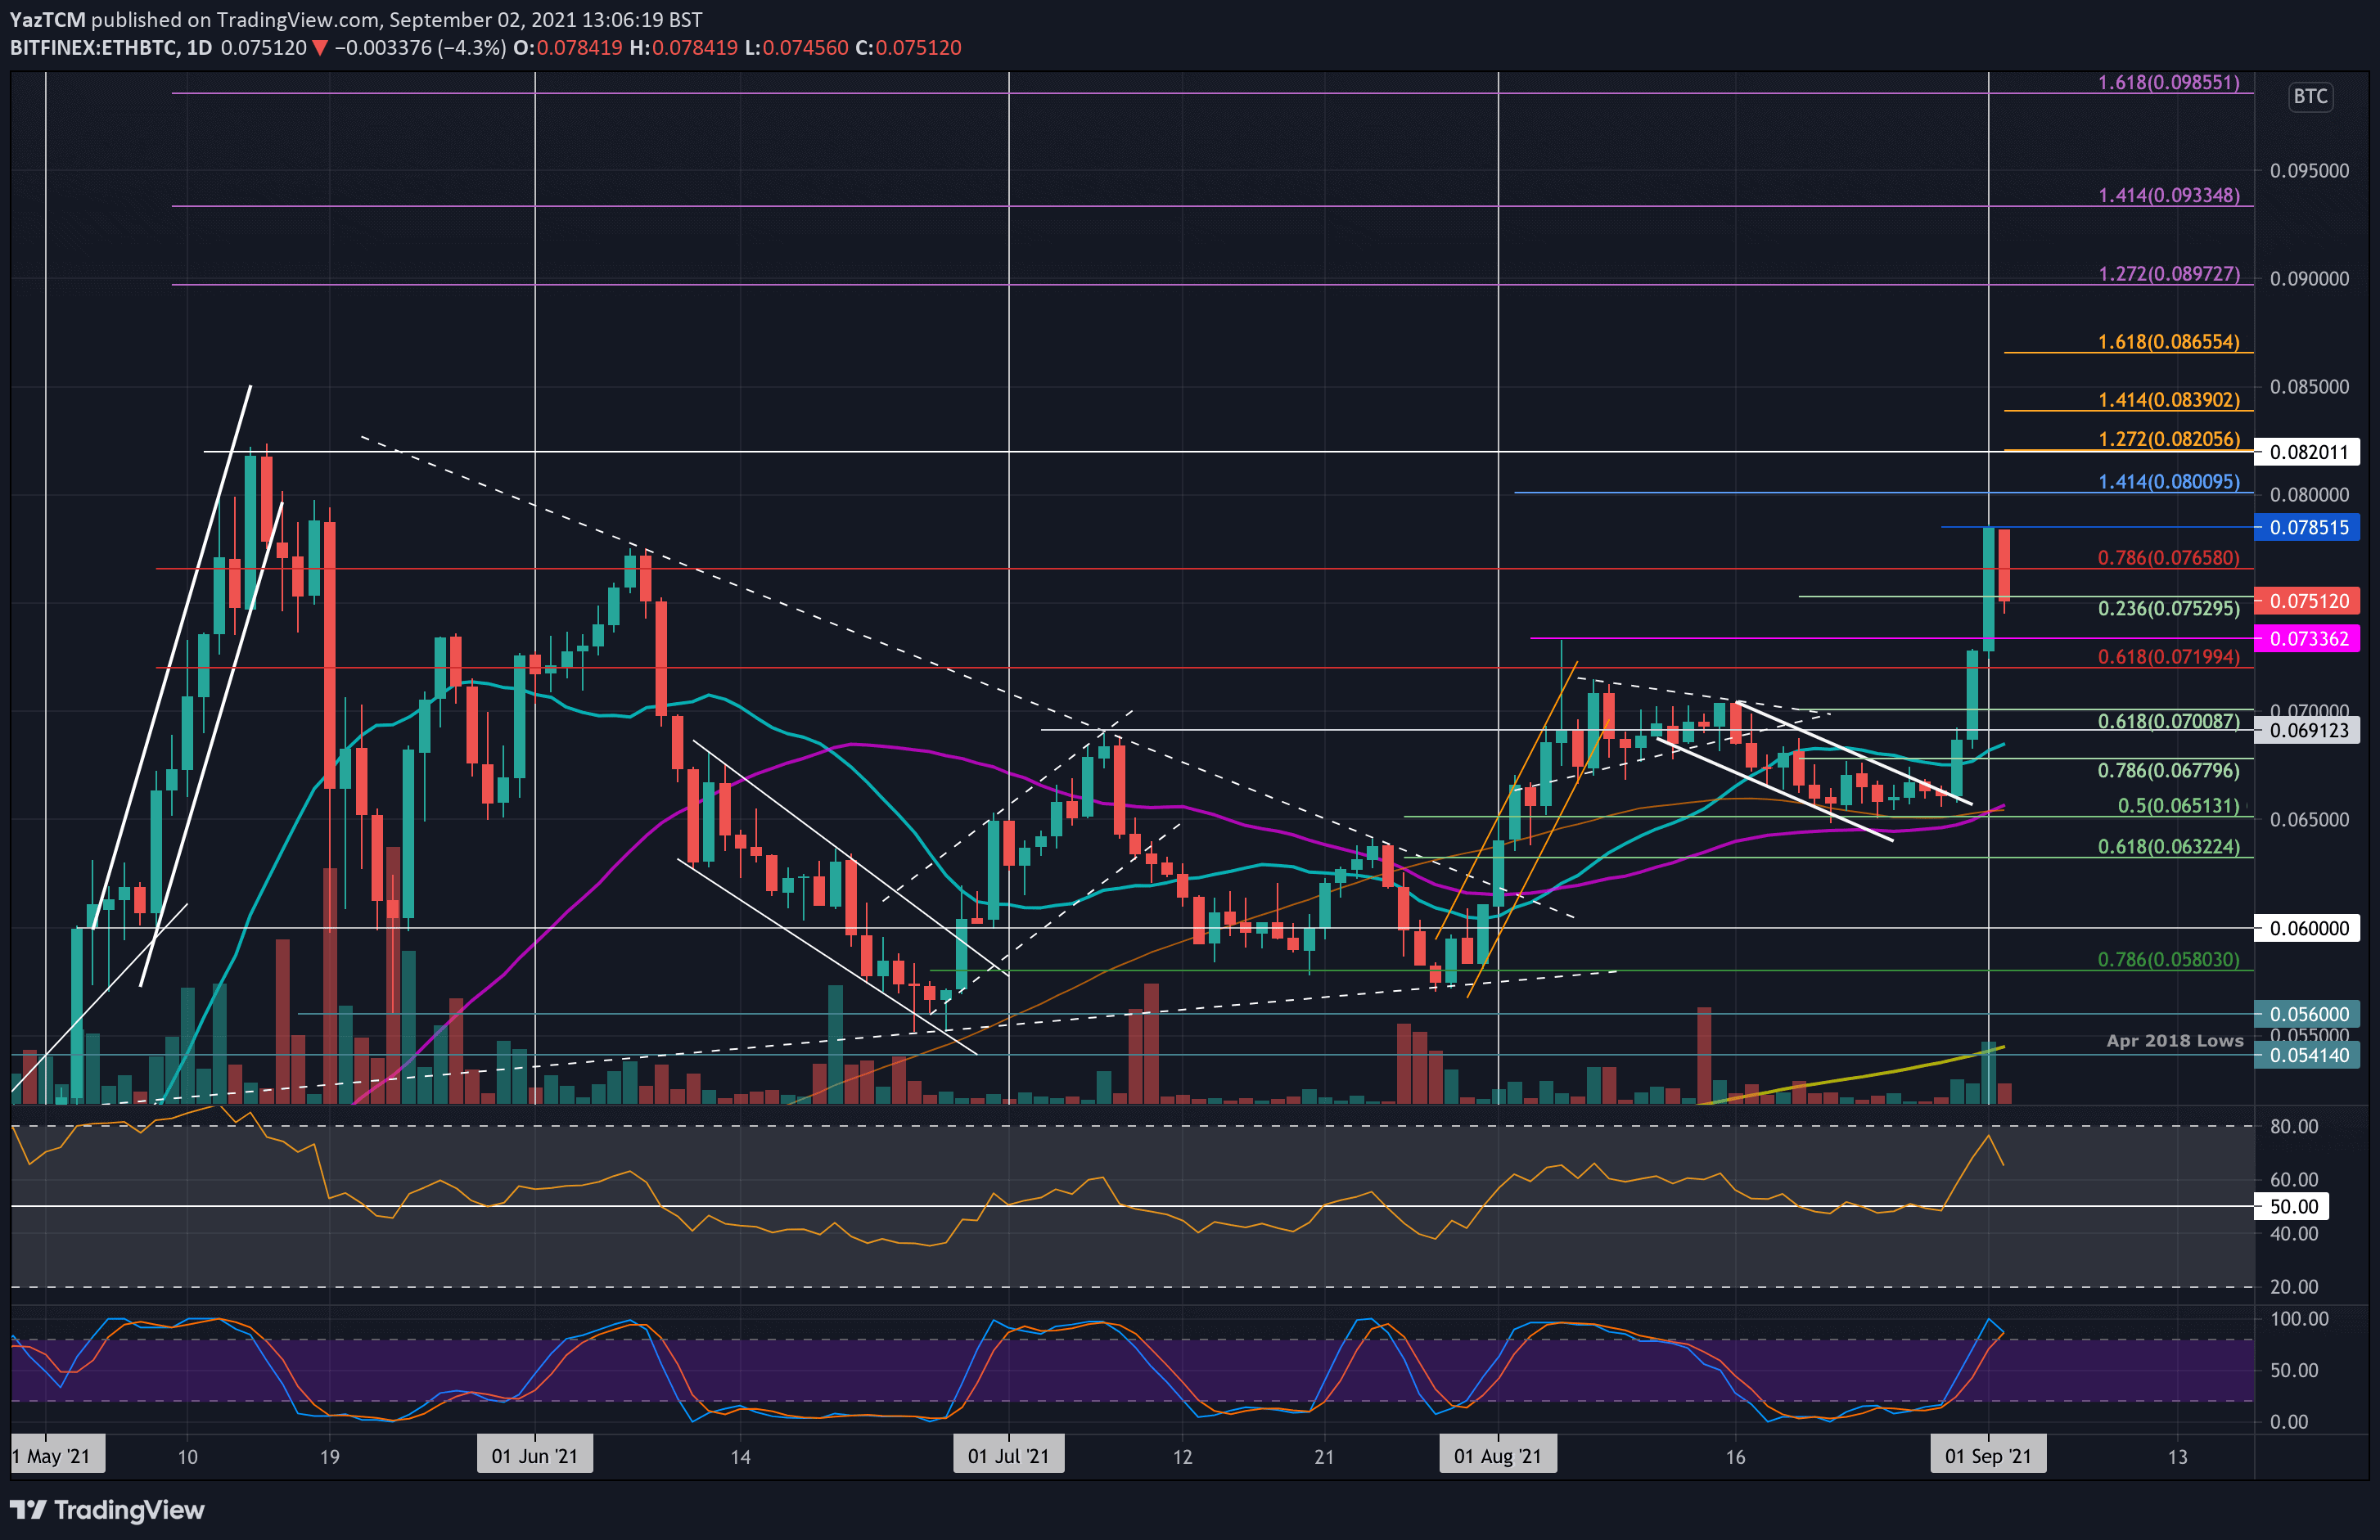
Key Support Levels: 0.0733 BTC, 0.07 BTC, 0.0677 BTC.
Key Resistance Levels: 0.0765 BTC, 0.0785 BTC, 0.08 BTC.
ETH continues to outperform BTC as it broke the August highs at 0.0733 BTC yesterday. The cryptocurrency made it above a descending price channel on Monday as it climbed to 0.068 BTC.
On Tuesday, ETH goes beyond 0.07 BTC as it surged past resistance at 0.072 BTC (bearish .618 Fib). Yesterday, ETH carried on climbing to break the August high as it continued to 0.0765 BTC (Bearish .786 Fib) and reach as high as 0.0785 BTC. It has since dropped to 0.0751 BTC.
Moving forward, the first resistance now lies at 0.0765 BTC (bearish .786 Fib). This is followed by 0.0785 BTC, 0.08 BTC, and 0.082 BTC (May highs).
On the other side, the first support lies at 0.0733 BTC (August highs). This is followed by 0.07 BTC (.618 Fib), 0.0677 BTC (.786 Fib), and 0.065 BTC (100-day & 50-day MA).
The RSI spiked higher over the past few days but is still not yet extremely overbought, indicating the buyers still have room to push further.