Ethereum saw a sharp price decline of 7% over the past 24 hours, with the price falling back below $300 to around $287. The recent pullback comes after Ethereum created fresh multi-year lows against BTC after dropping beneath the support at 0.024 BTC.
Ethereum remains the second-largest cryptocurrency by market value, with a market cap of $30 billion. Despite consistently falling against BTC all year, its value relative to the dollar has increased by 75% over the past 3 months.
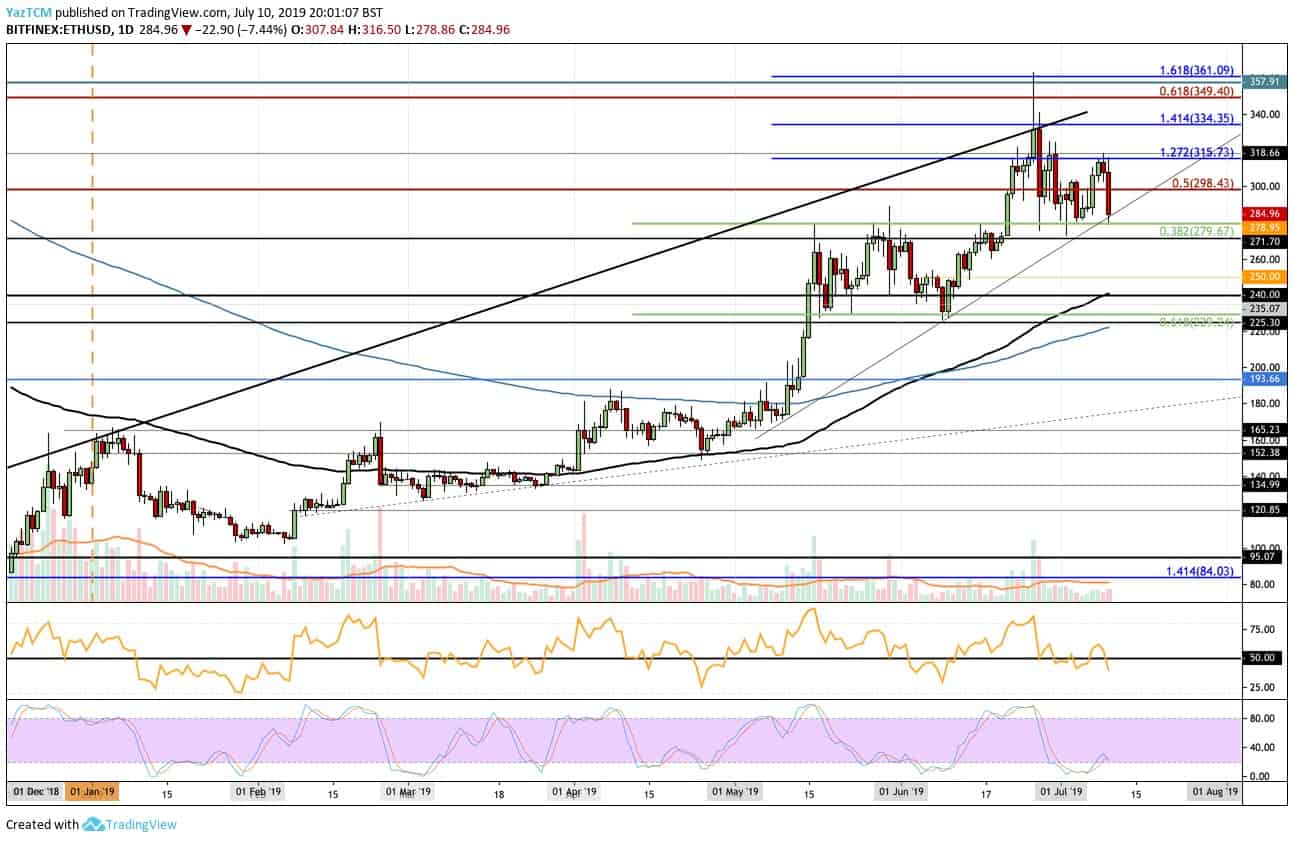
Looking at the ETH/USD 1-day chart:
- Since our previous ETH/USD analysis, Ethereum’s price has rebounded from the highlighted support at $280. ETH managed to break back above $300 to reach a high of $315 before pulling back below $300.
- From above: The nearest levels of resistance lie at $300 and $315. Above this, resistance lies at $334 and $350. The resistance at $350 is bolstered by a long-term bearish .618 Fibonacci retracement level. If the bulls continue above $350, higher resistance is located at $360, $380 and $400.
- From below: The nearest level of support is $279 and the short-term rising trend line. Beneath this, further support lies at $271, $250 and $240. The support at $240 is further strengthened by the 100-day EMA.
- The trading volume has remained fairly low during July and shows no sign of increasing.
- The Stochastic RSI bullish crossover signal played out recently as we wait for the Stochastic RSI to expand, although it looks like it will be headed lower again. Furthermore, the RSI itself recently broke below 50 which shows the bears are in control of the market.
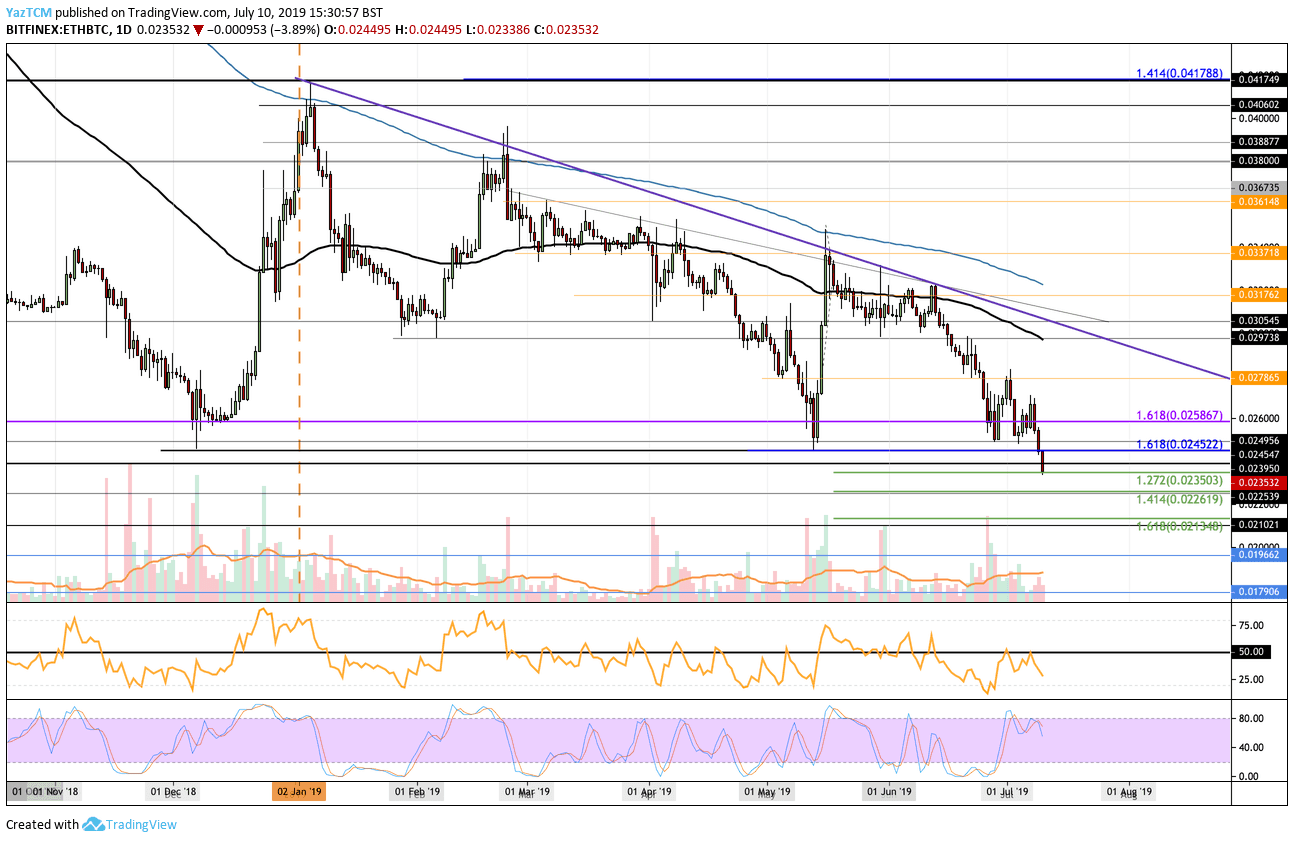
Looking at the ETH/BTC 1-day chart:
- Against Bitcoin, things are getting pretty rough. The Ethereum price recently dropped beneath the strong support around 0.024 BTC and has traveled lower to find current support at 0.02350 BTC provided by a downside 1.272 Fibonacci Extension.
- From above: The nearest level of resistance now lies at 0.024 BTC. Above this, resistance exists at 0.02452 BTC, 0.025 BTC, and 0.026 BTC. If the buyers move the price above 0.026 BTC, higher resistance is located at 0.027 BTC and 0.02786 BTC.
- From below: If the sellers push the market beneath the current support at 0.02350 BTC, the next level of support lies at 0.02261 BTC, provided by the downside 1.414 Fibonacci extension. Beneath this level, support lies at 0.022 BTC and 0.02134 BTC.
- The trading volume has started to increase as holders continue to drop their ETH bags.
- The RSI was recently turned away from the 50 level, indicating that sellers are still not ready to give up control of the market.
SPECIAL OFFER (Sponsored)
LIMITED OFFER 2024 for CryptoPotato readers at Bybit: Use this link to register and open a $500 BTC-USDT position on Bybit Exchange for free!
Disclaimer: Information found on CryptoPotato is those of writers quoted. It does not represent the opinions of CryptoPotato on whether to buy, sell, or hold any investments. You are advised to conduct your own research before making any investment decisions. Use provided information at your own risk. See Disclaimer for more information.
Cryptocurrency charts by TradingView.