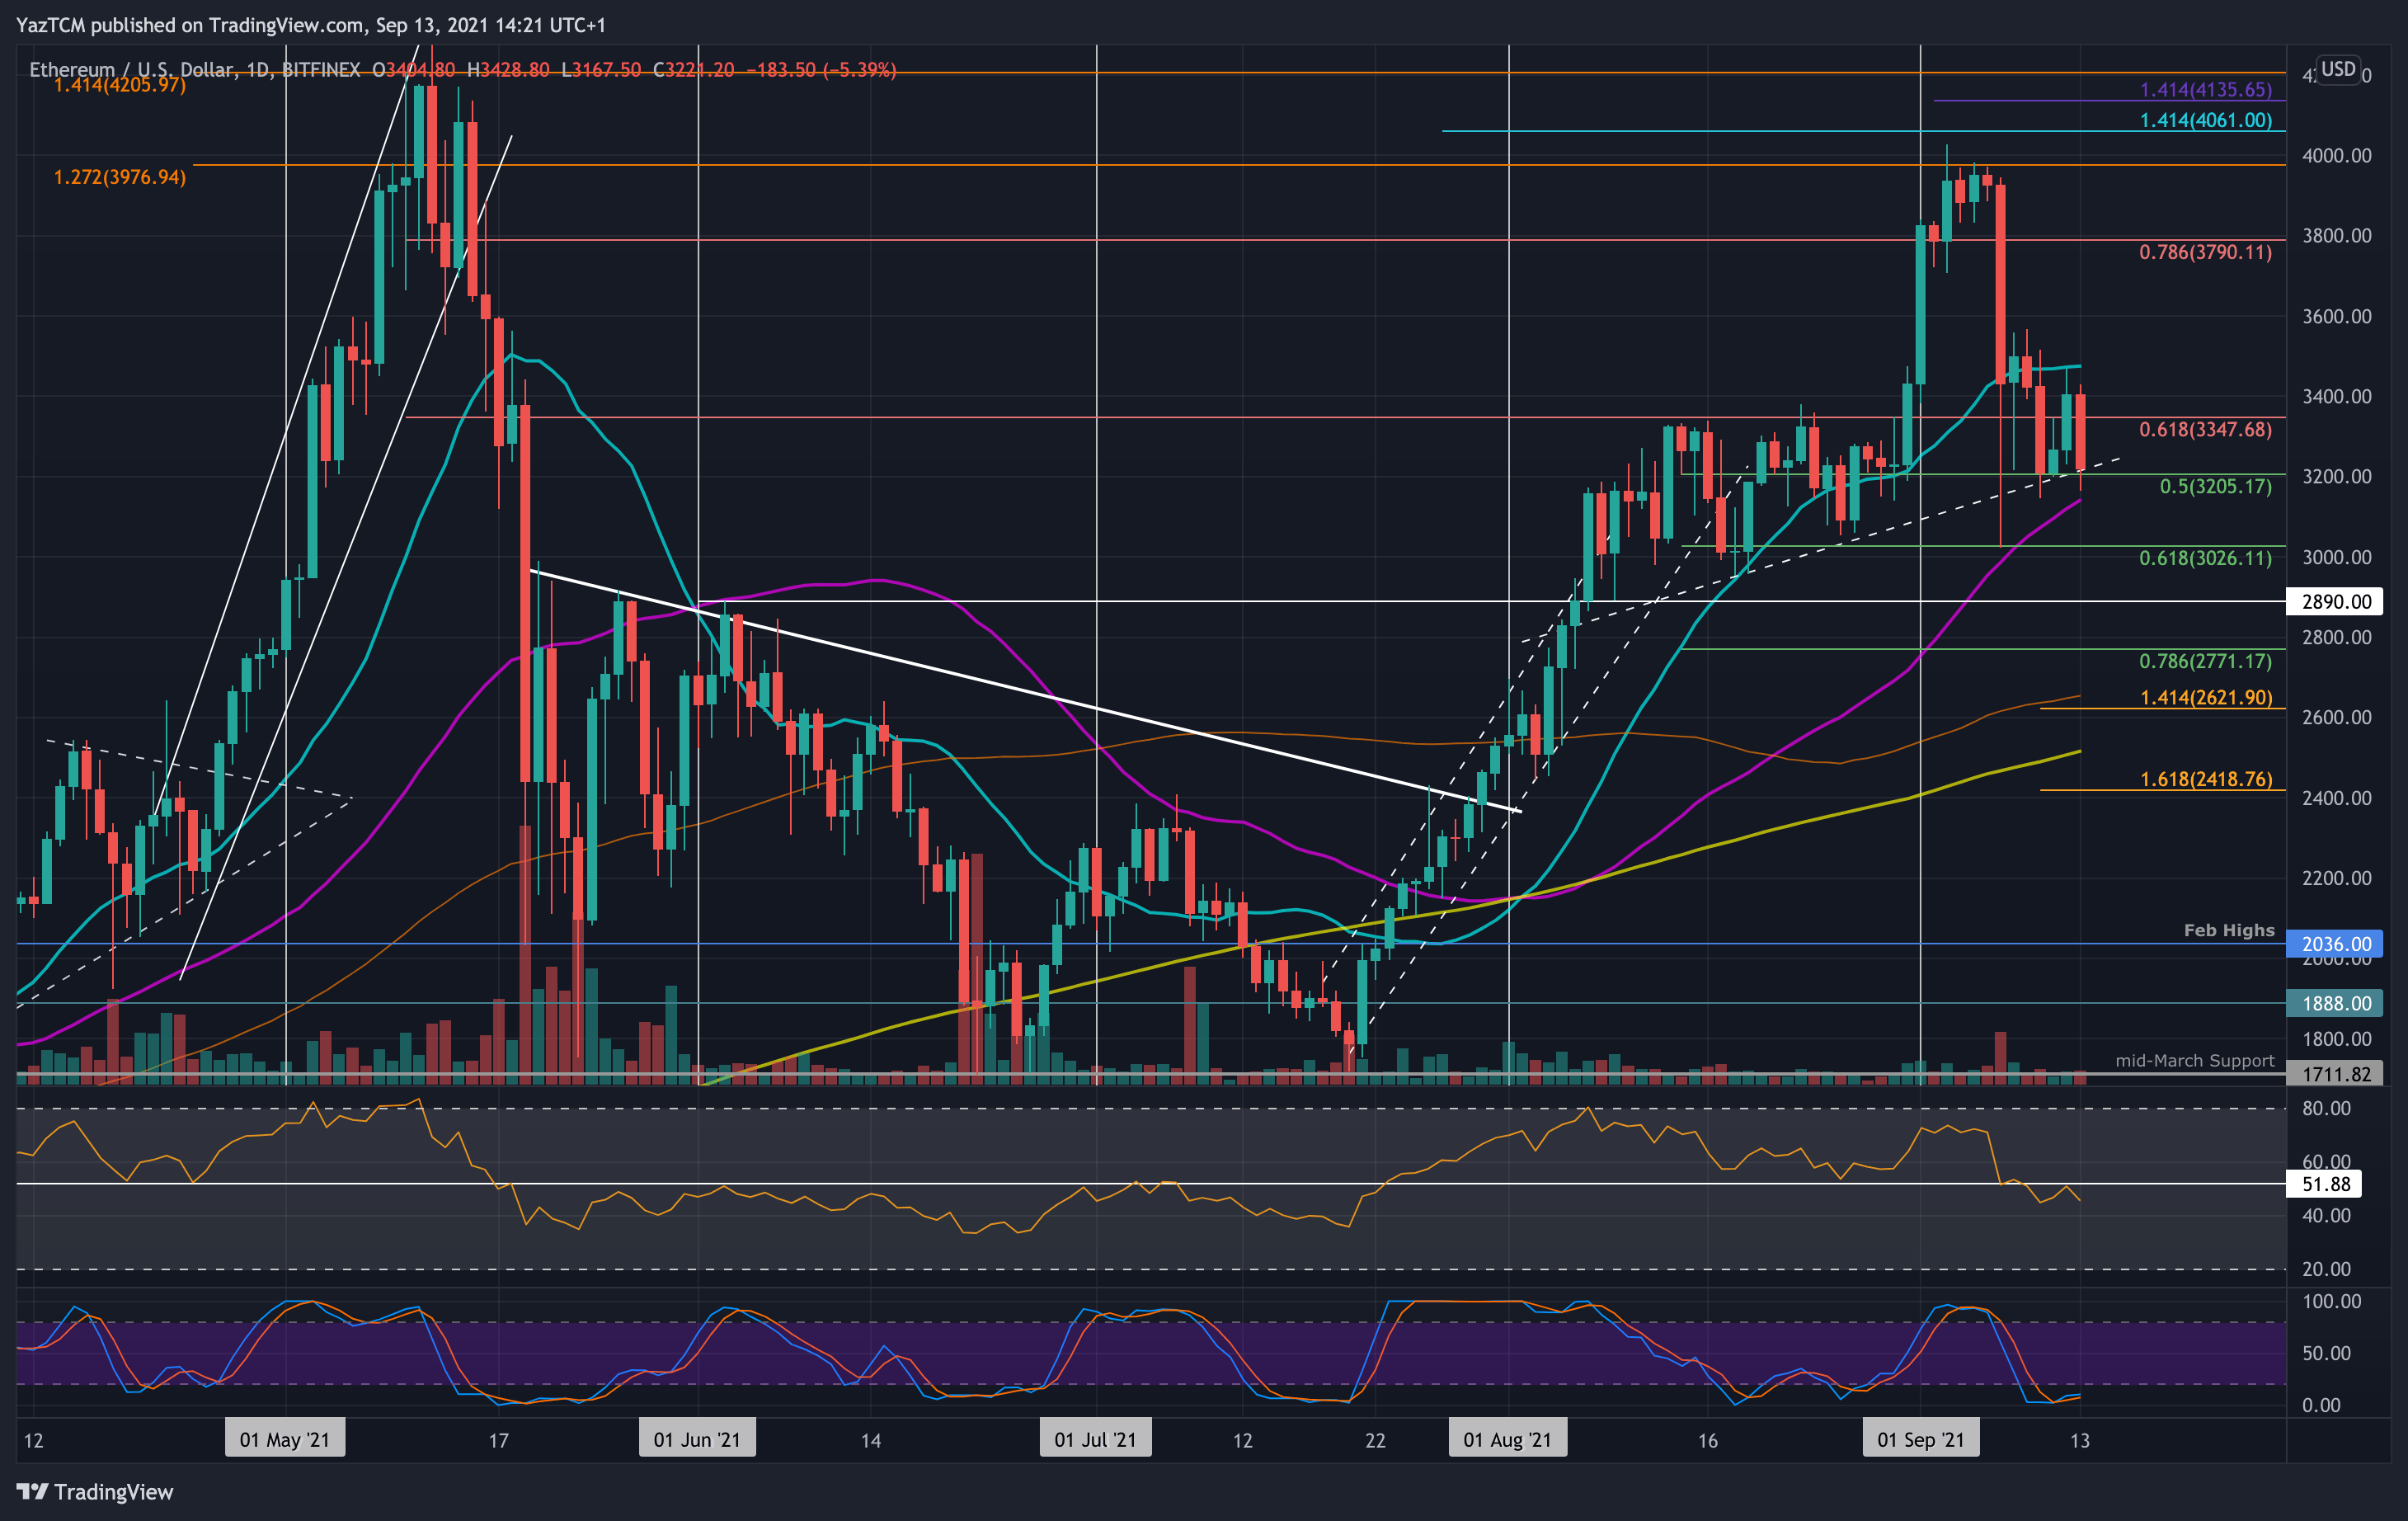
ETH/USD Daily Chart. Source: TradingView.
Key Support Levels: $3200, $3150, $3000.
Key Resistance Levels: $3350, $3480, $3600.
After Tuesday’s market wipeout, ETH is now down a total of 15% on the week after falling from near $4000. The coin found support at $3200 (.5 Fib) over the weekend and rebounded higher.
Unfortunately, it could not break the 20-day MA resistance at $3485 yesterday and rolled over from there today as it fell by 2% to meet the current $3200 (.5 Fib) level again. The support here is also bolstered by an ascending trend line that extends to early August.
Looking ahead, the first major support lies at $3200 (.5 Fib). This is followed by $3150 (50-day MA), $3000 (.618 Fib), and $2890.
On the other side, the first resistance lies at $3350 (bearish .618 Fib). This is followed by $3480 (20-day MA), $3600, and $3790 (bearish .786 Fib).
The RSI slipped beneath the midline last week for the first time since late July. This indicates that the bears are now in control of the market momentum again.
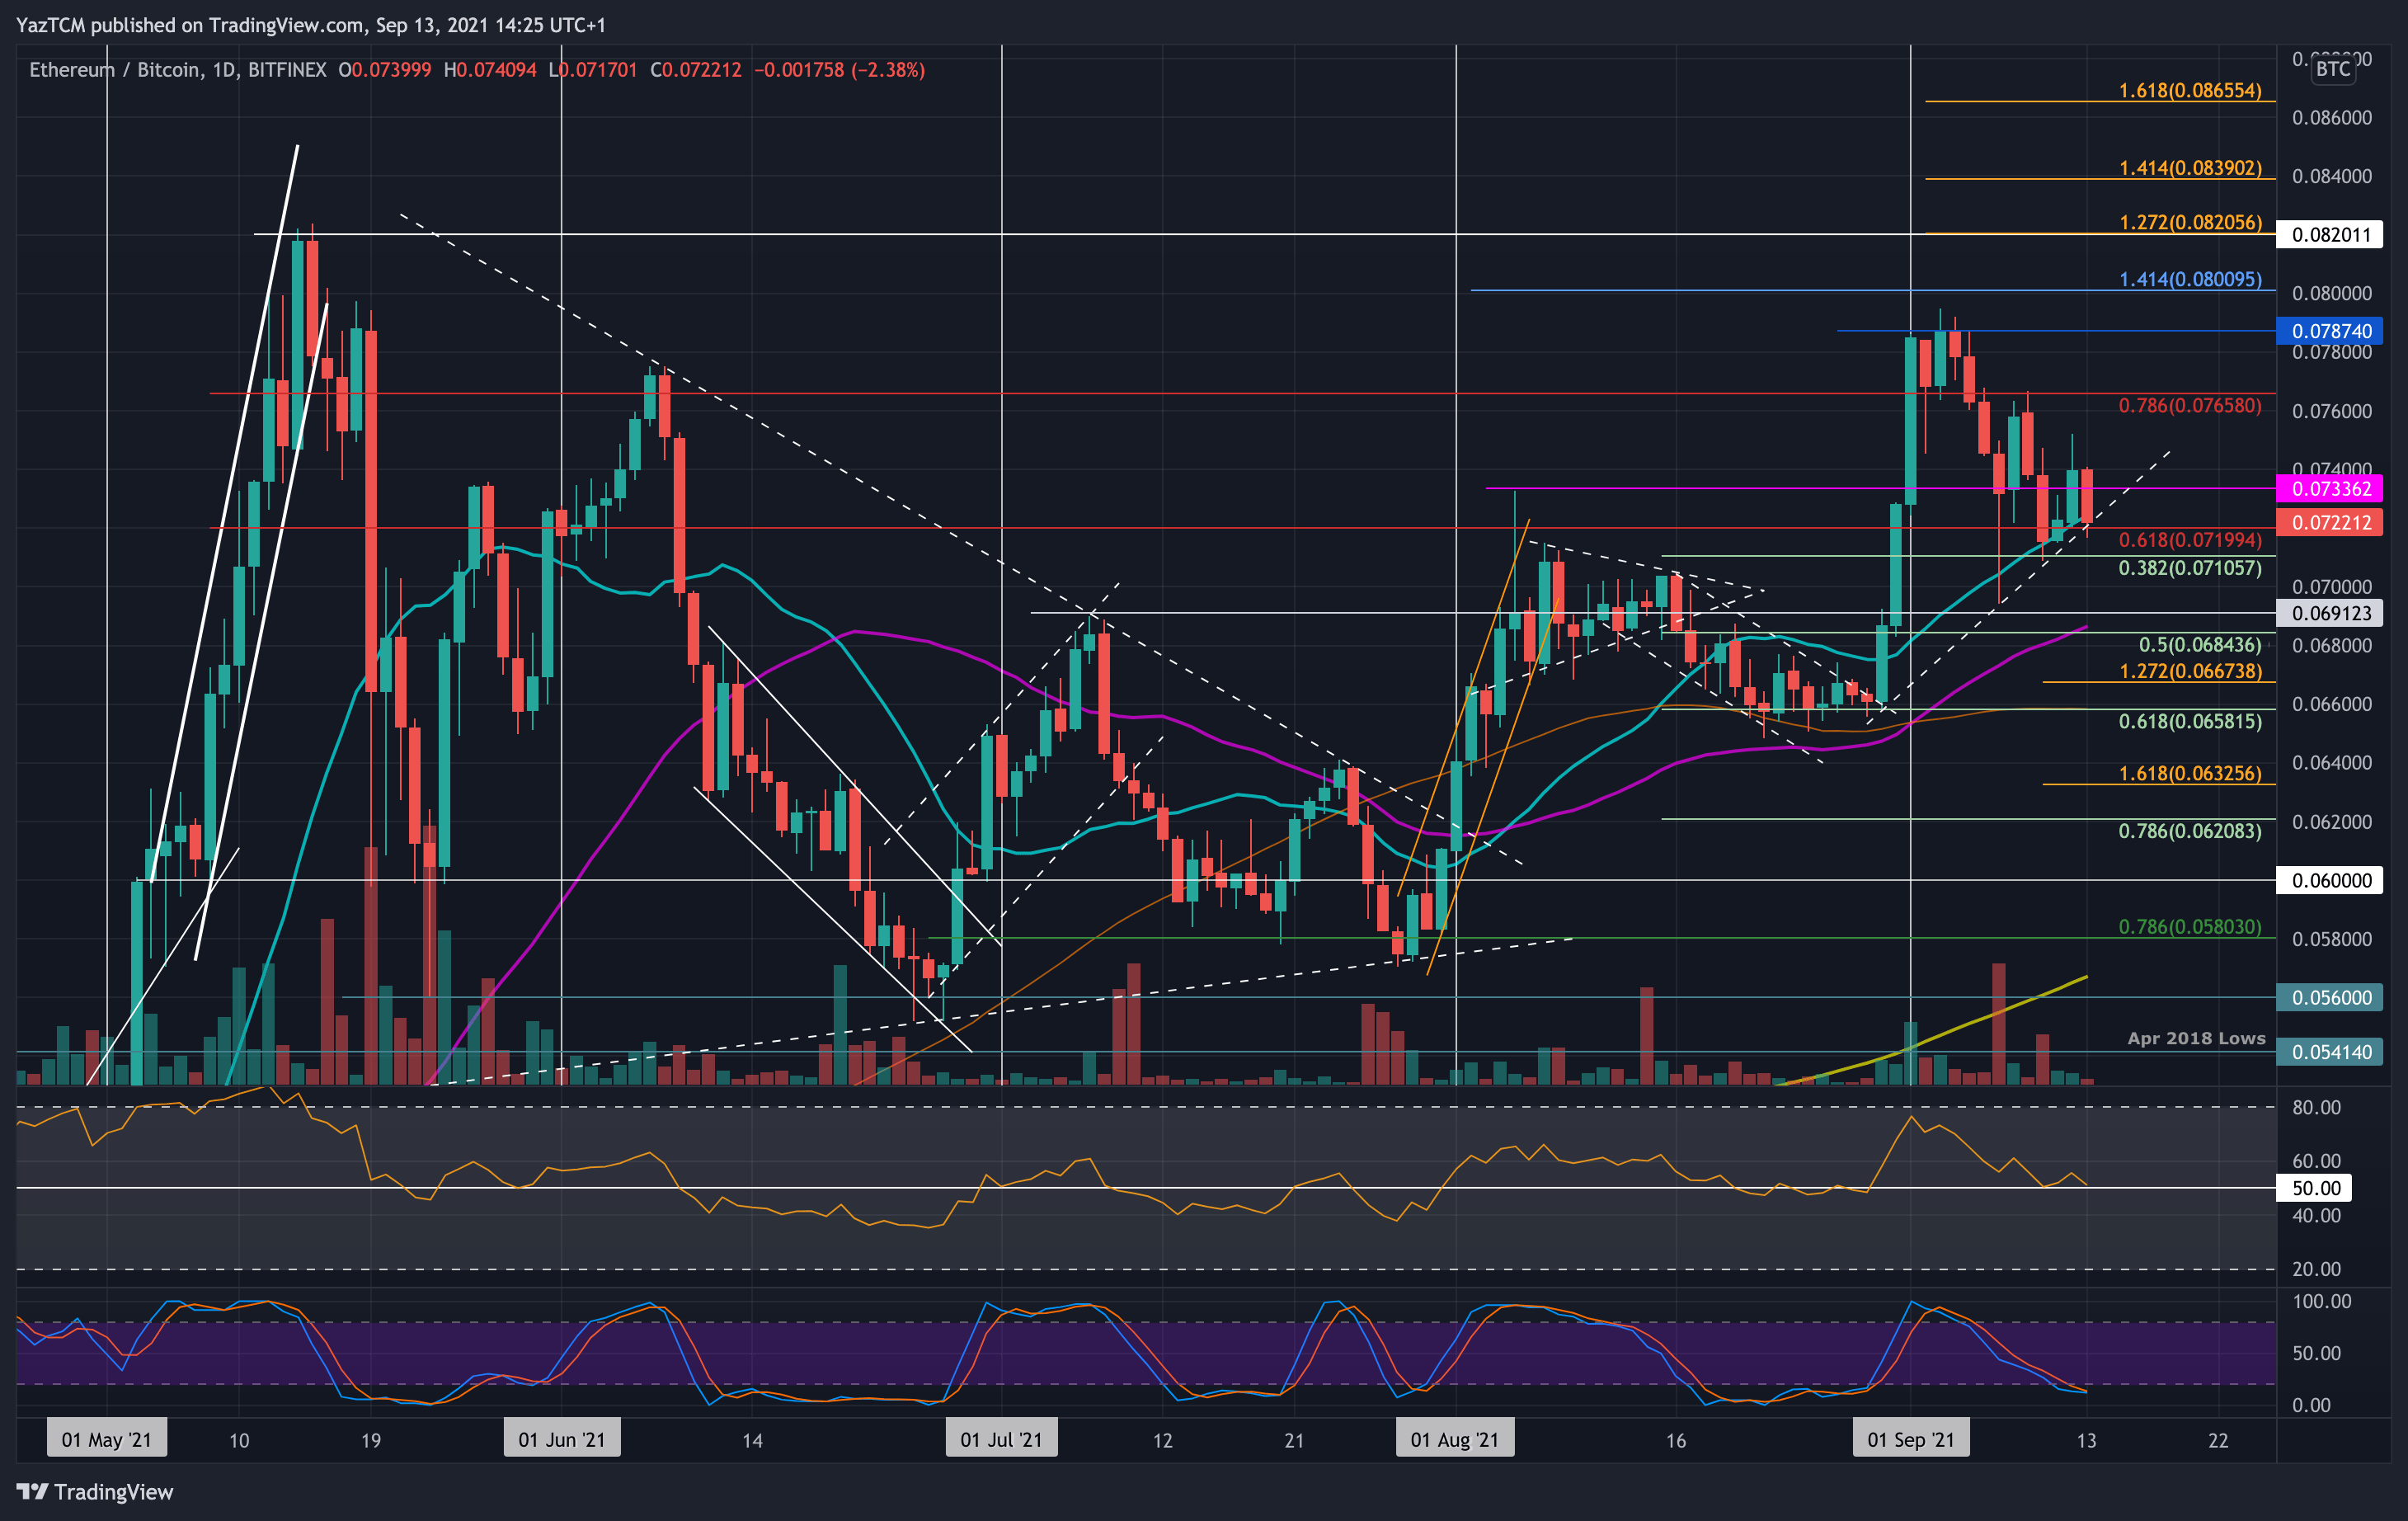
Key Support Levels: 0.0722 BTC, 0.071 BTC, 0.07 BTC.
Key Resistance Levels: 0.074 BTC, 0.0765 BTC, 0.078 BTC.
ETH is also heading lower against BTC as it attempts to defend the 20-day MA near 0.0722 BTC. The coin dropped from 0.076 BTC last week until support was found at the 20-day MA over the weekend.
It did rebound from the 20-day MA yesterday to reach as high as 0.0752 BTC. Unfortunately, it was unable to close a daily candle above 0.074 BTC and has since rolled over back to the 0.0722 BTC level (20-day MA). The support here is also further bolstered by a short-term ascending trend line.
Moving forward, if the sellers break the 20-day MA and the rising trend line support, the first support lies at 0.071 BTC (.382 Fib). This is followed by 0.07 BTC, 0.0685 BTC (.5 Fib & 50-day MA), and 0.0667 BTC (downside 1.272 Fib Extension).
On the other side, the first resistance lies at 0.074 BTC. This is followed by 0.0765 BTC (beraish .786 Fib), 0.078 BTC, and 0.0795 BTC (September highs).
The RSI is now trading at the midline here, indicating indecision within the market. If it dips beneath the midline, the bearish momentum will increase and is likely to drive ETH down toward 0.07 BTC.