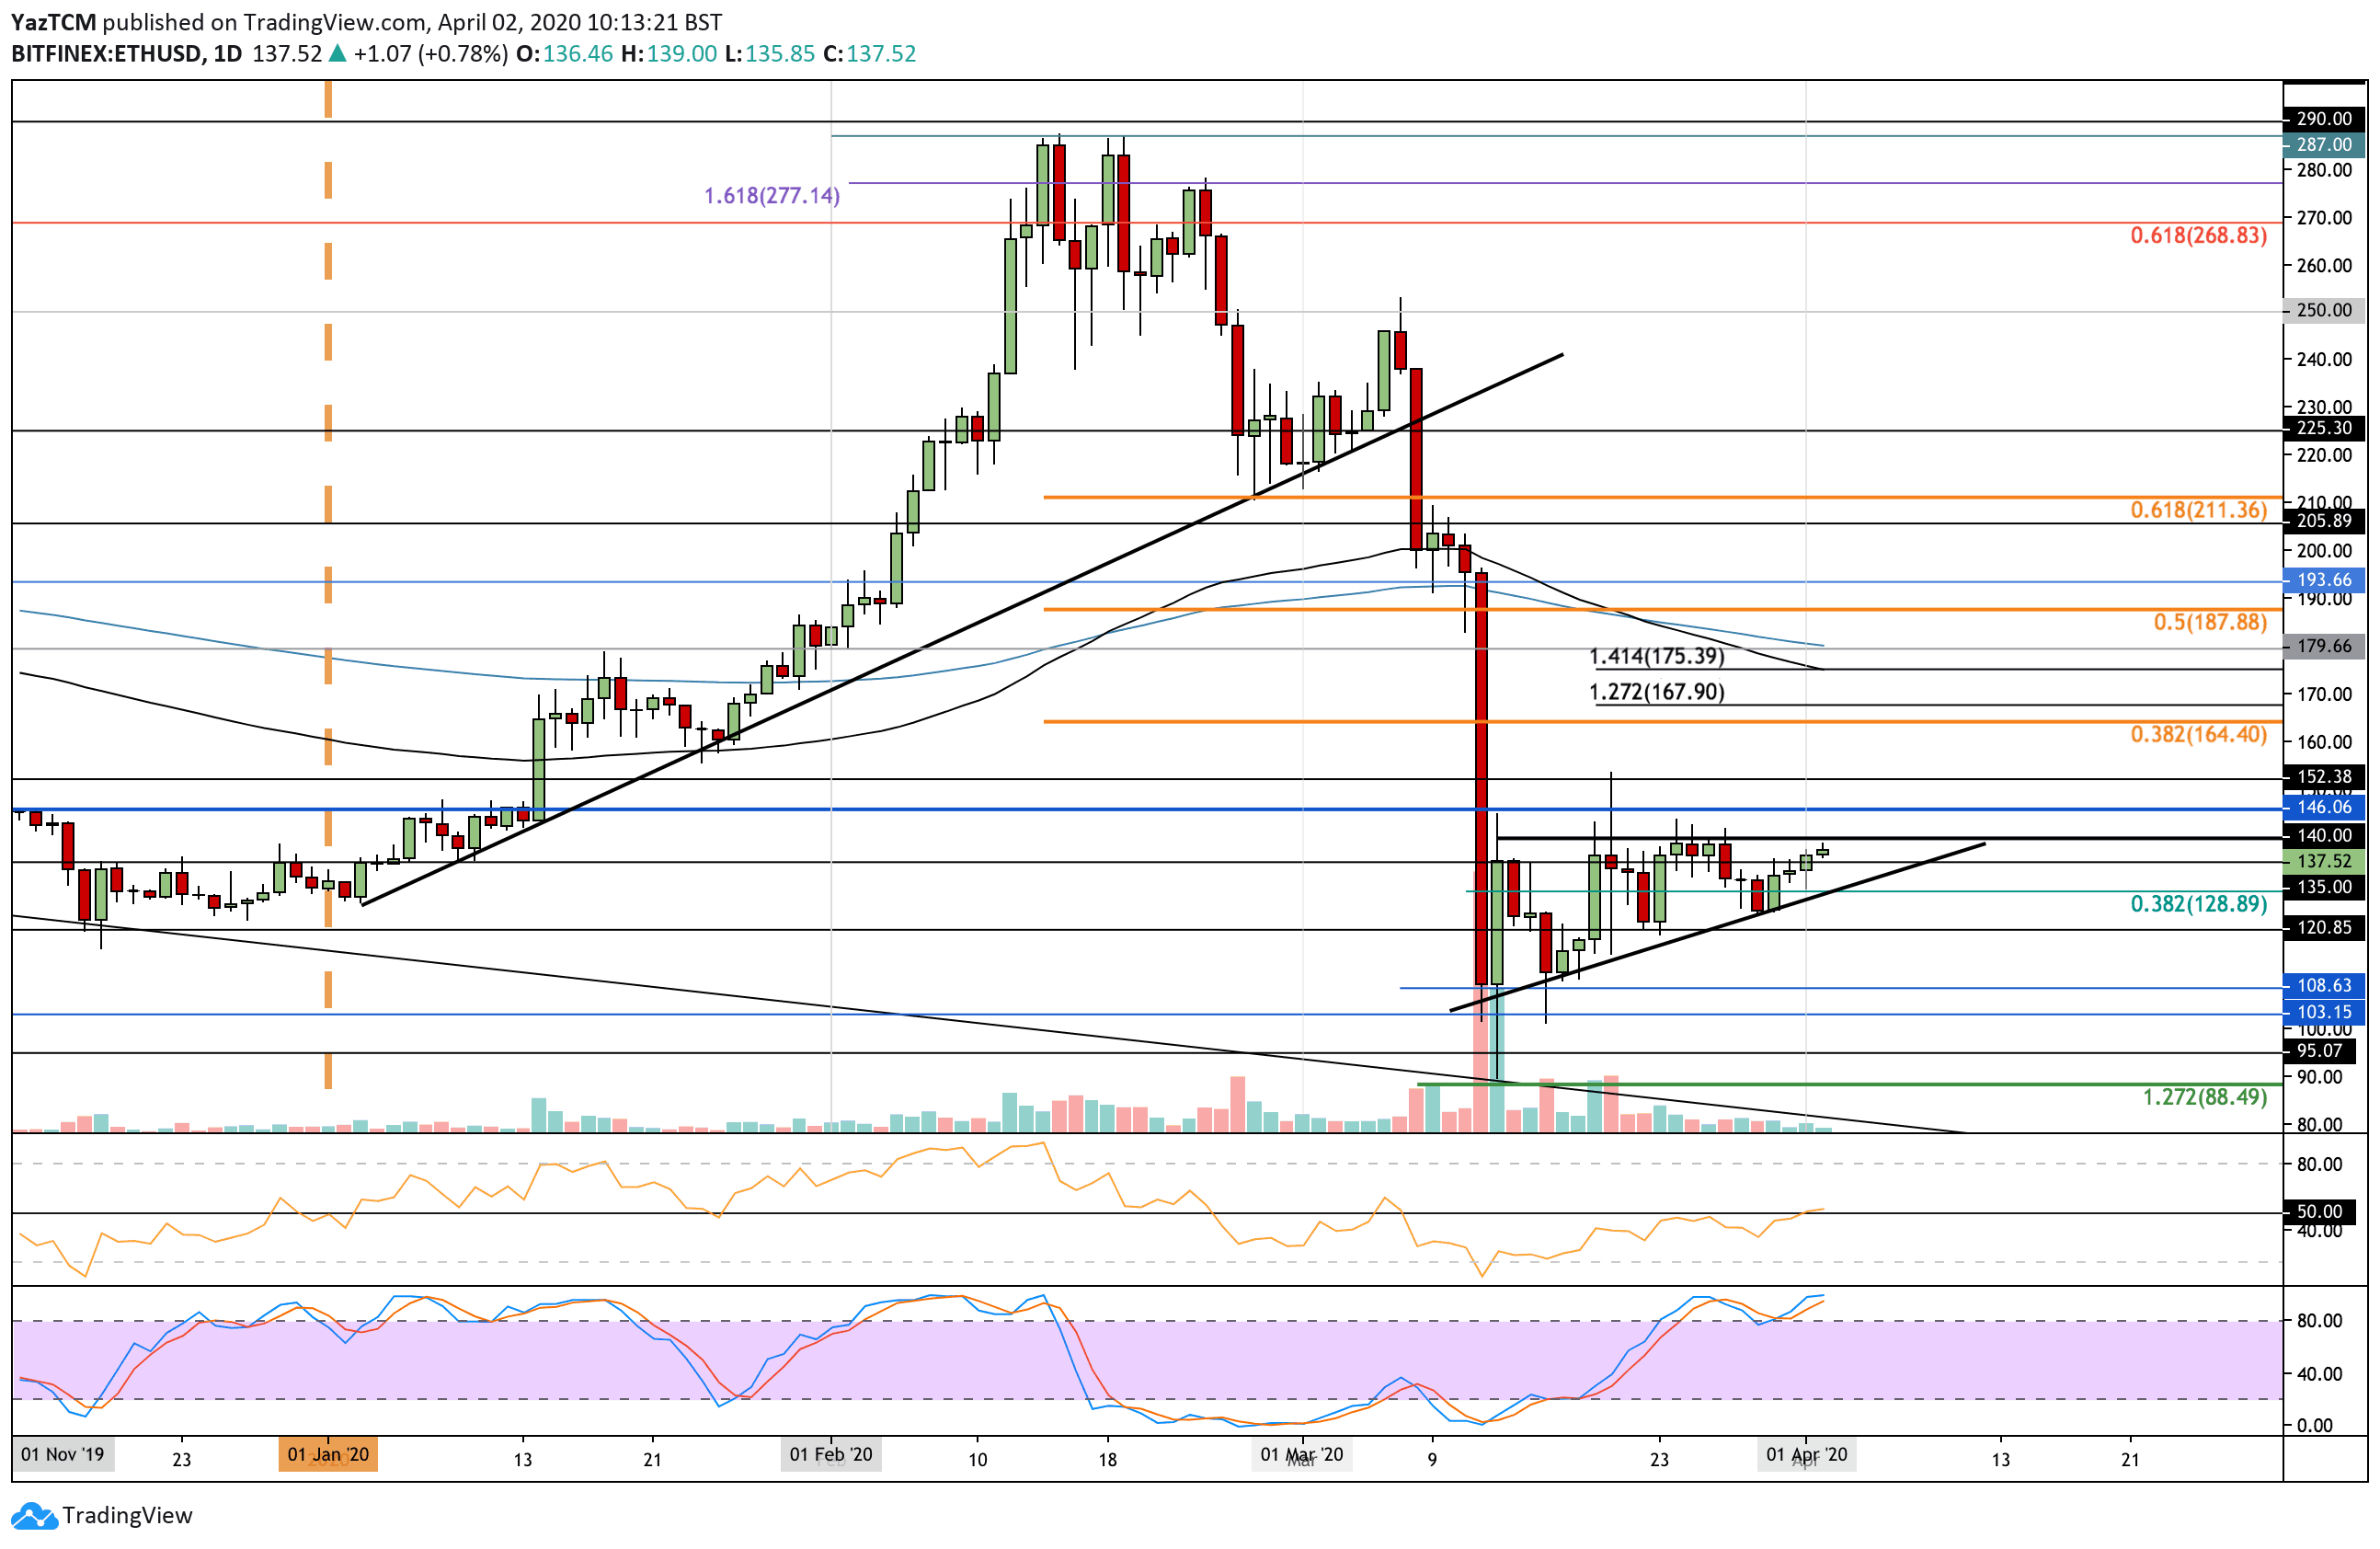
ETH/USD:
Support: $130, $129, $120.
Resistance: $145, $150, $165.
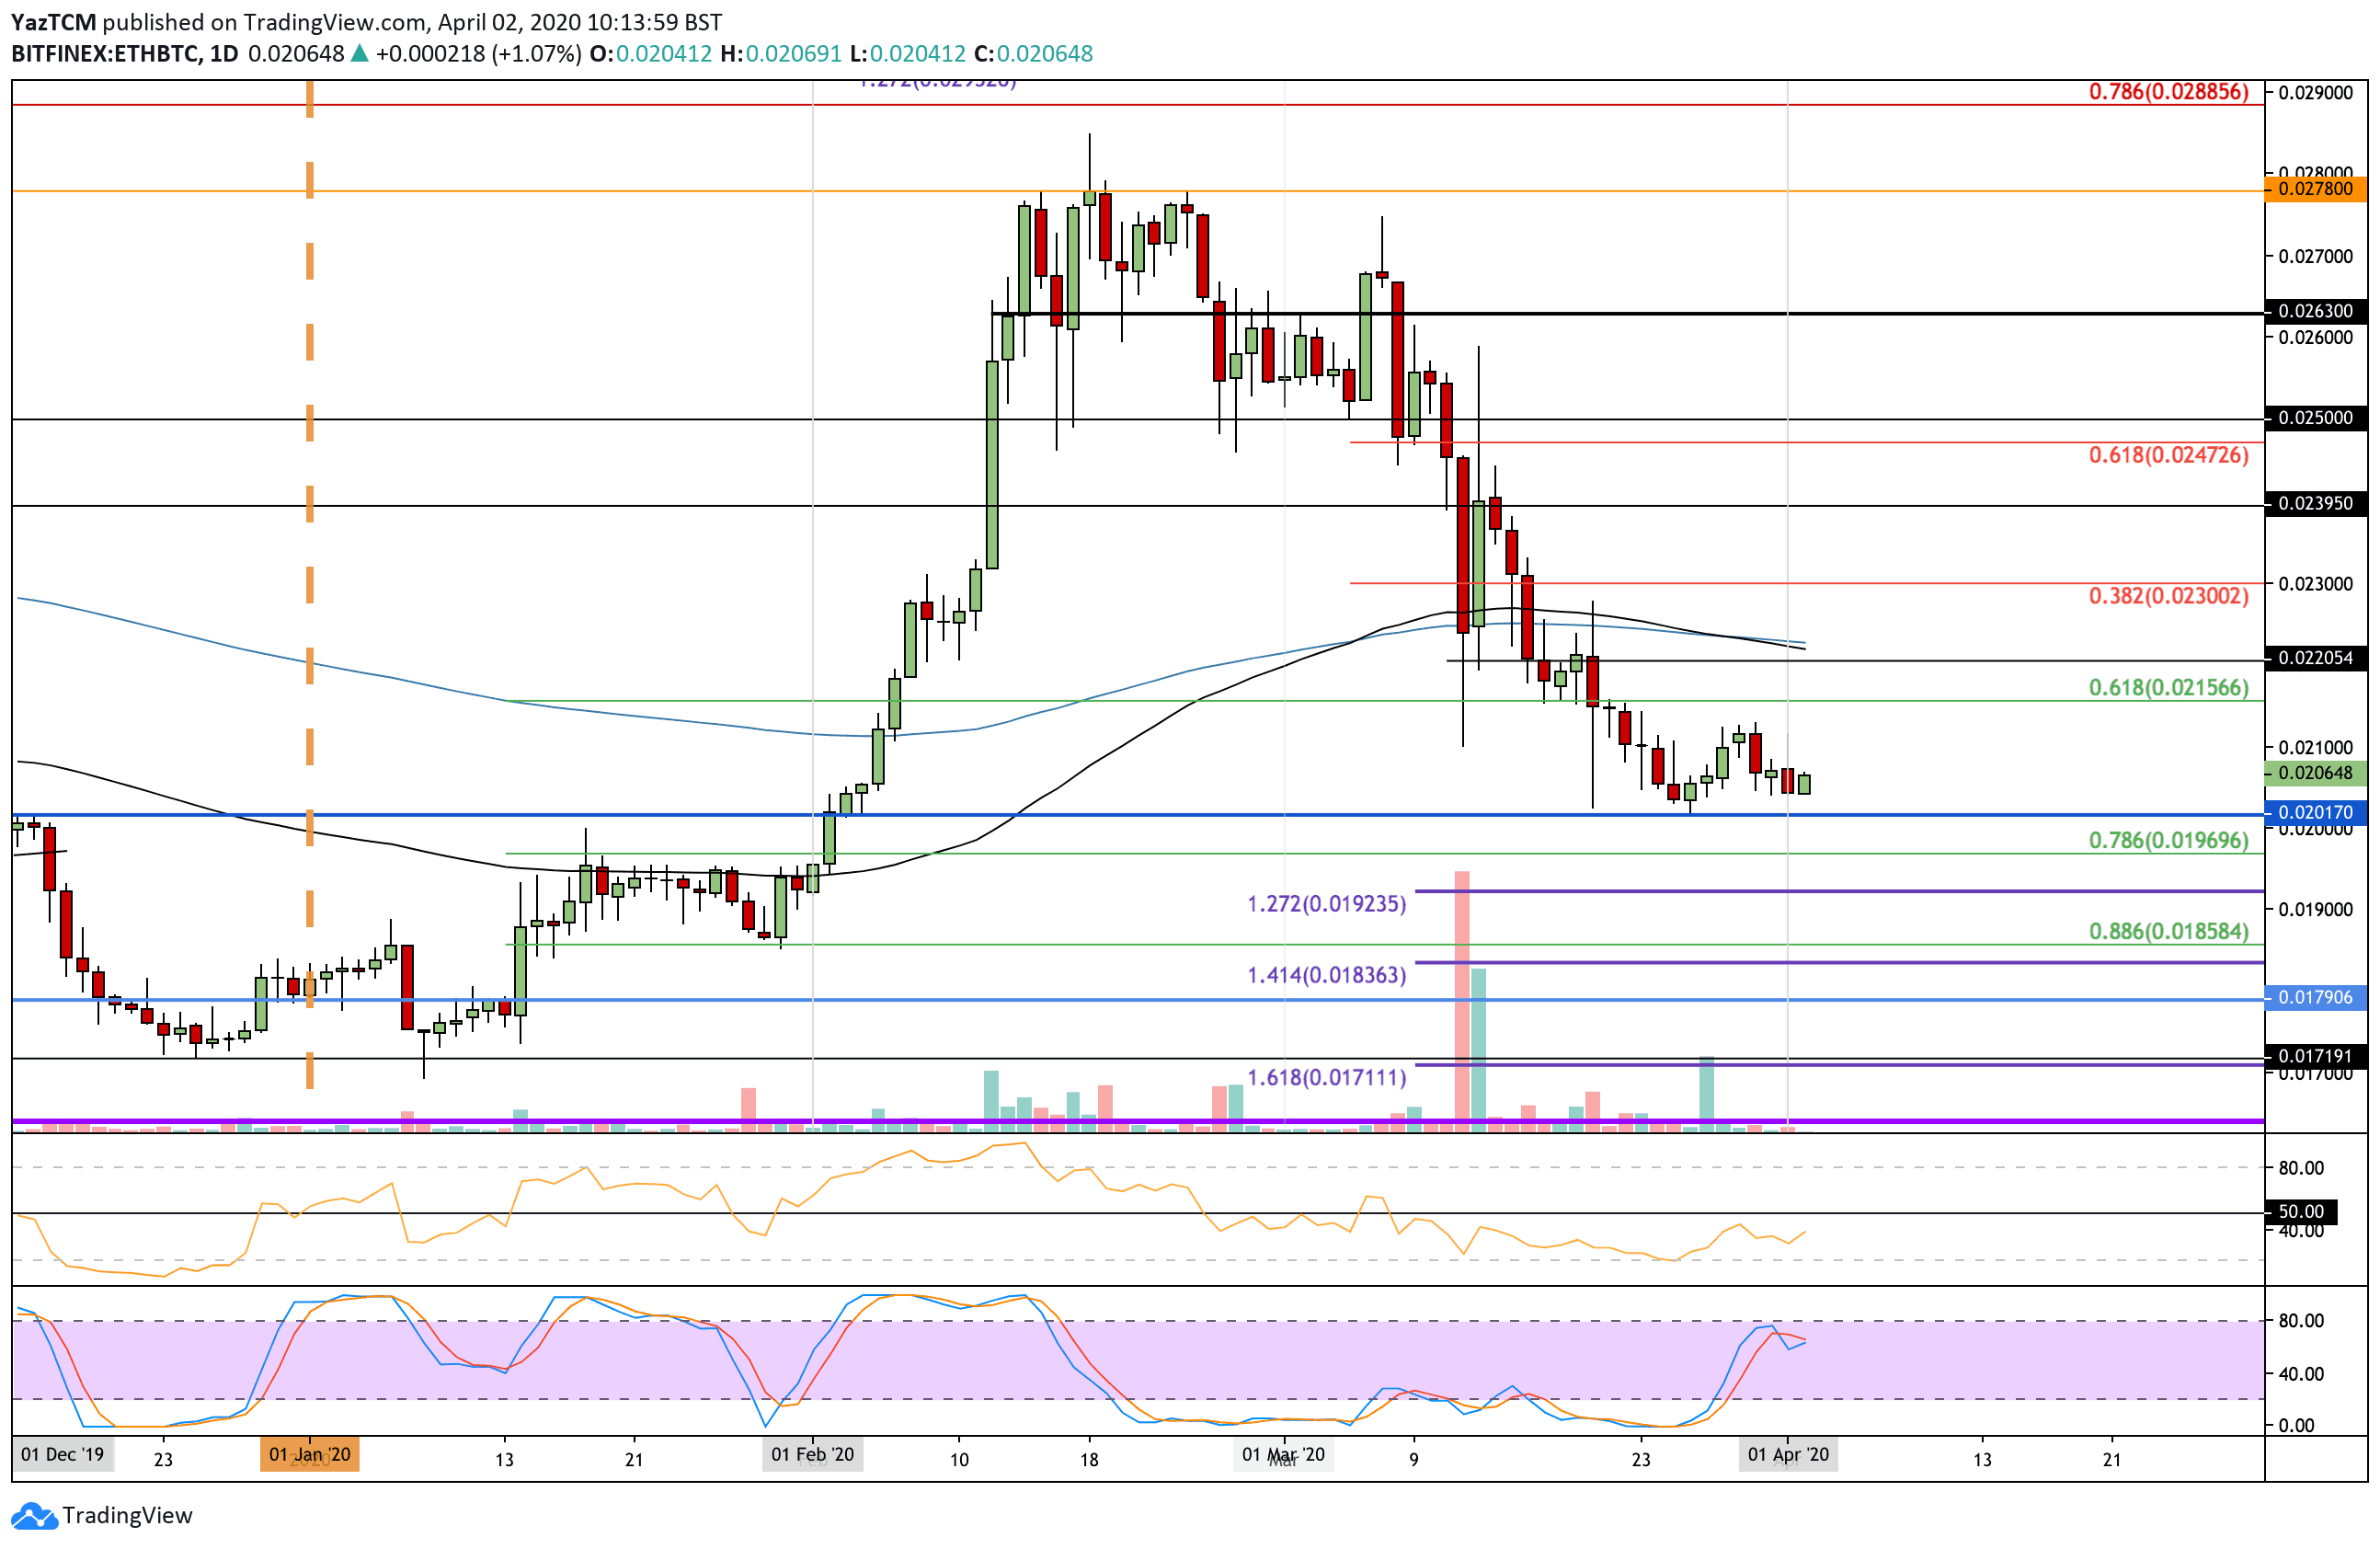
ETH/BTC:
Support: 0.0201 BTC, 0.0196 BTC, 0.0192 BTC.
Resistance: 0.021 BTC, 0.02222 BTC, 0.023 BTC.
Ethereum has been increasing over the past 4-days since rebounding from the rising trend line. It has now reached the upper boundary of the current consolidation pattern at $140 and is attempting to break above.
A break above $140 will push ETH above this triangle and allow it to head above $150 into the next level of strong resistance at $165.
If ETH can break the triangle, resistance lies at $145 and $150. Above this, resistance is expected at $165 (bearish .382 Fib Retracement) and $175 (100-days EMA).
Toward the downside, the first level of support lies at $135. Beneath this, added support is at $129 (short term .382 Fib Retracement), the rising support trend line, and $120.
The RSI is in the process of breaking above 50 for the first time since the market collapse. This shows the buyers are attempting to gain control over the market momentum. It will need to continue above 50 to the bullish momentum to increase.
Against Bitcoin, Ethereum dropped as low as 0.0204 BTC yesterday but has since rebounded as the bulls attempt to climb above 0.021 BTC.
Ethereum will still need to rise much higher and break above 0.0222 BTC before we can start to see some promising price action for the coin.
Once 0.021 BTC is broken, resistance is expected at 0.0222 BTC, where lies the 100-days and 200-days EMA’s. Above this, resistance lies at 0.023 BTC (bearish .382 Fib Retracement) and 0.0239 BTC.
Toward the downside, the first level of strong support lies at 0.0201 BTC. Beneath 0.02 BTC, added support is found at 0.0196 BTC (.786 Fib Retracement), 0.0192 BTC (downside 1.272 Fib Extension), and 0.0185 BTC (.886 Fib Retracement).
The RSI is rising, which is a promising sign. However, it still remains beneath 50 as the sellers control the market momentum. A break above 50 will allow ETH to continue further higher above 0.022 BTC.