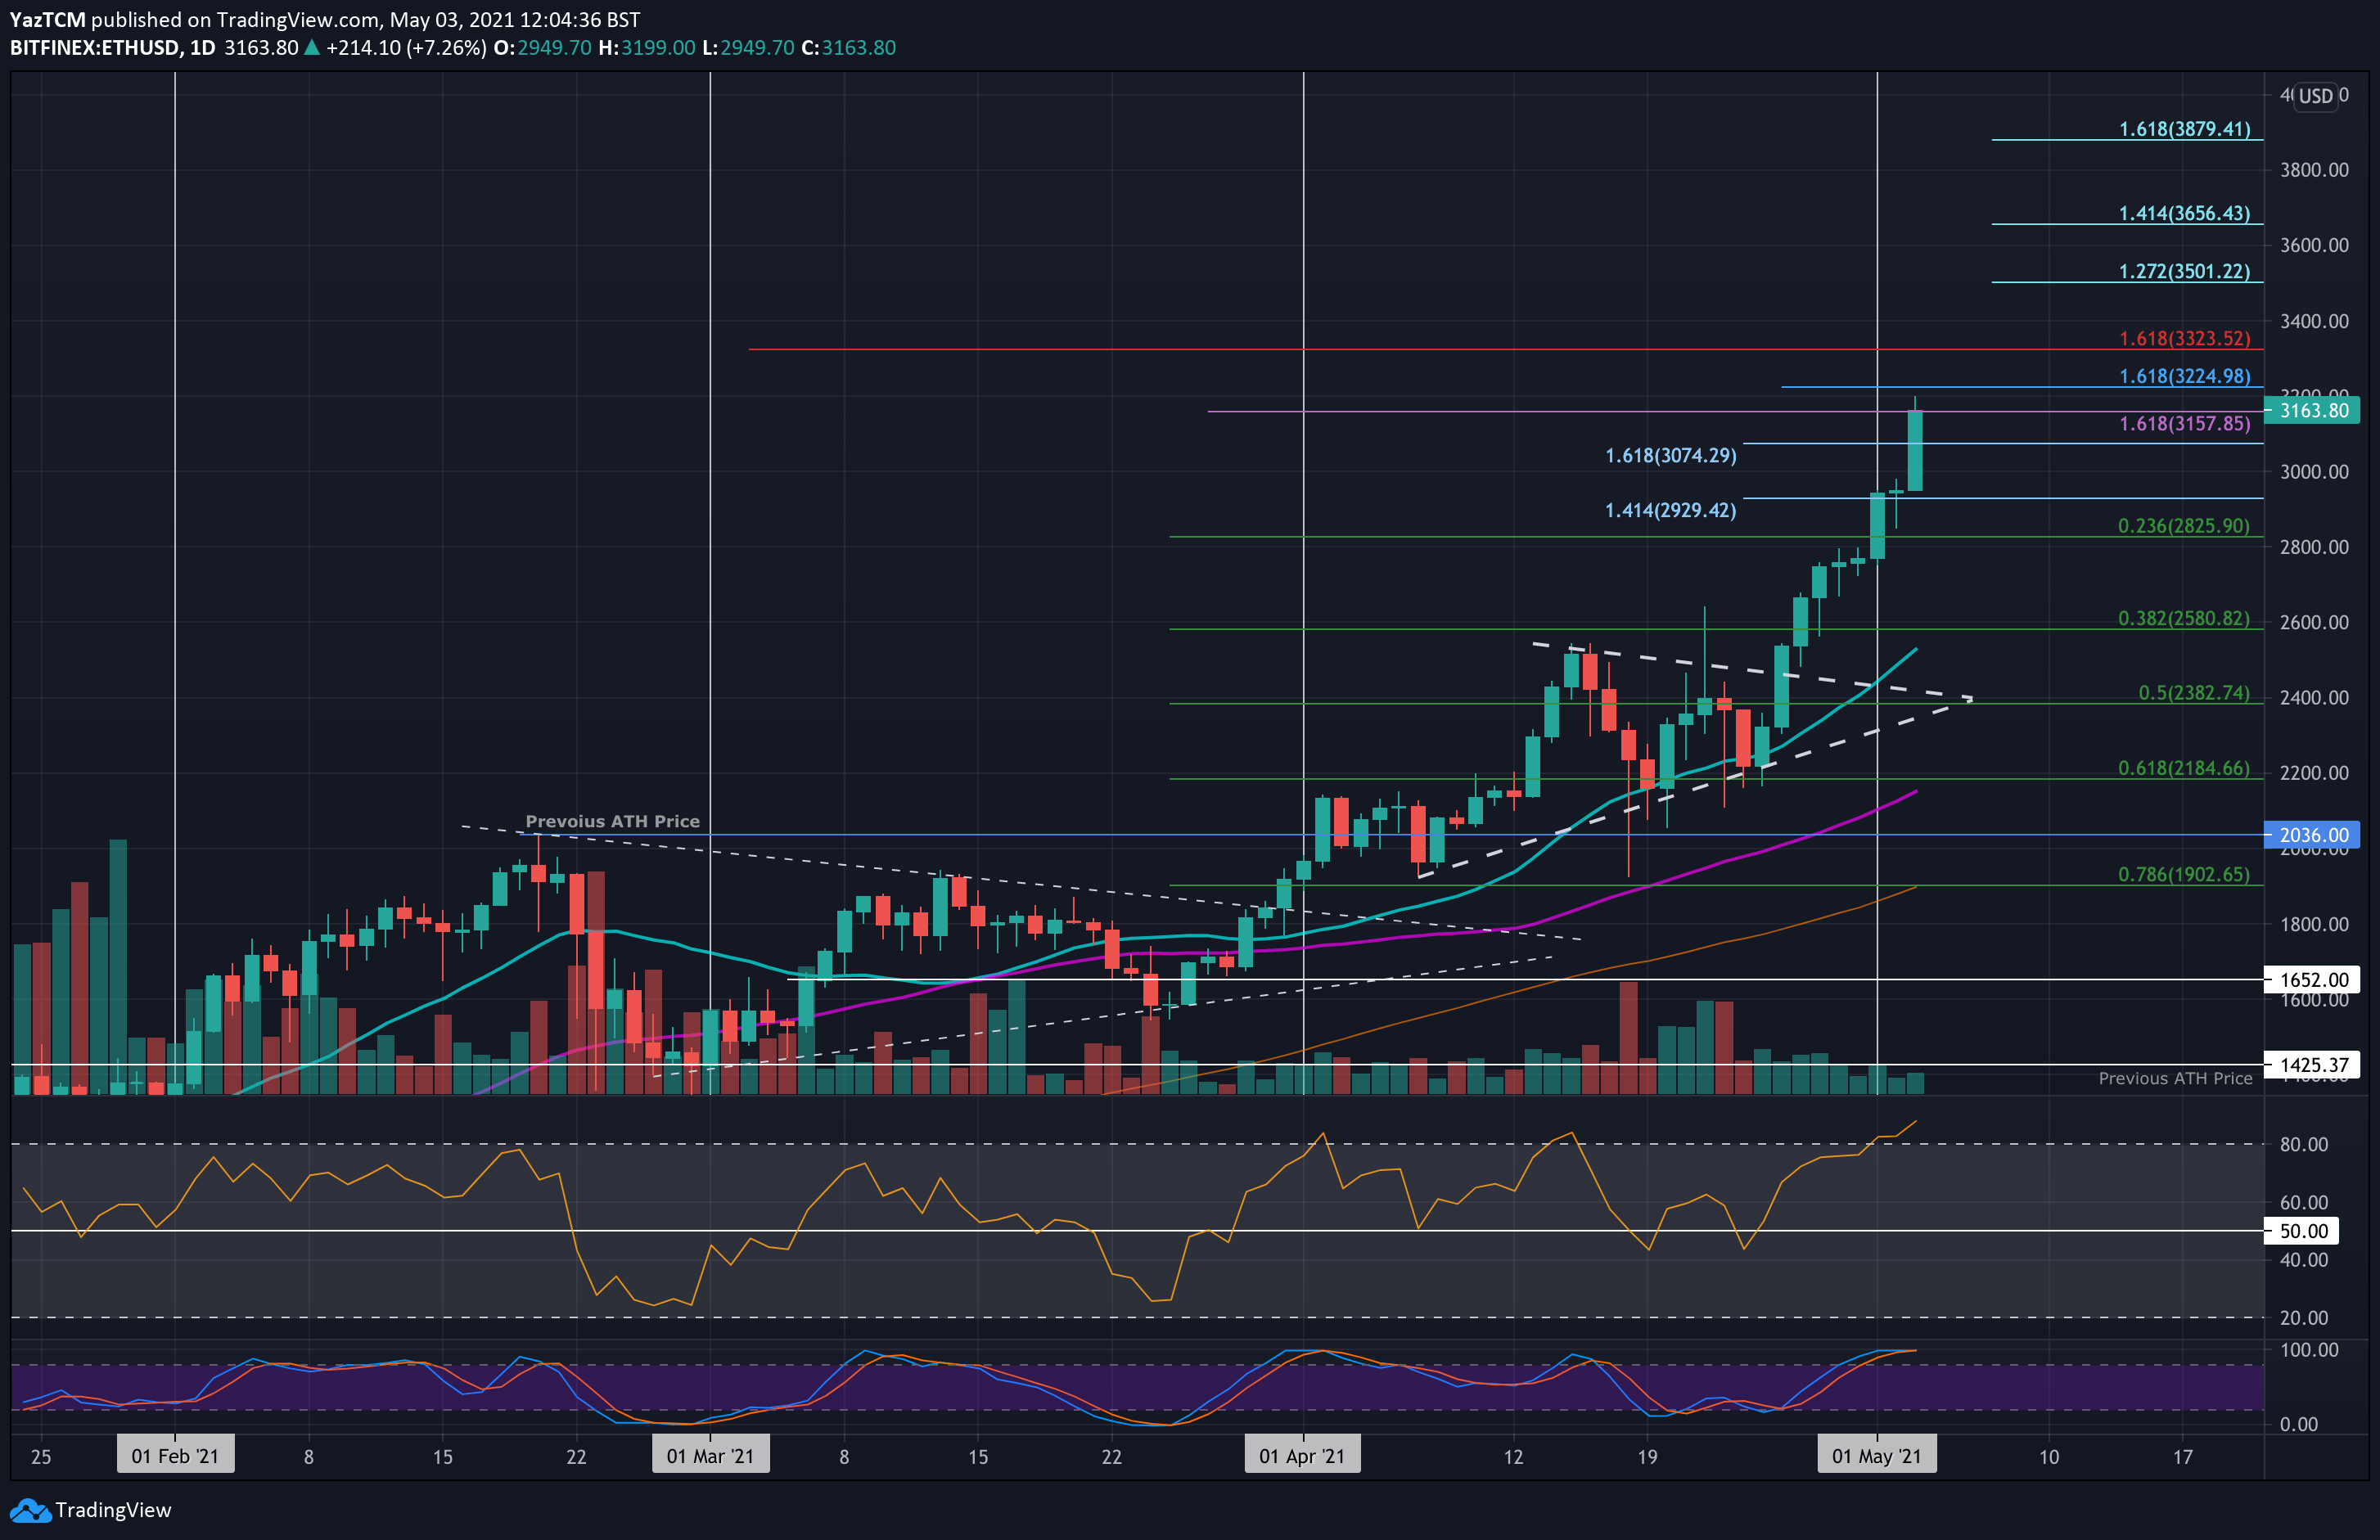
ETH/USD Daily Chart. Source: TradingView
Key Support Levels: $3075, $3000, $2825.
Key Resistance Levels: $3225, $3325, $3400.
Ethereum saw an impressive 7.5% price hike today, breaking past $3000 and reaching as high as $3200. The coin is now up by a total of 36% over the week after surging above a symmetrical triangle pattern last week.
From the breakout, ether continued to set new ATH prices each day until hitting resistance at $2800 last Thursday. This was finally penetrated on Saturday as the bulls surged into $2950. Today, the 7.5% increase allowed $3000 to finally be breached as ETH now battles resistance at around $3160.
Looking ahead, the first resistance above the ATH lies at $3225 (1.618 Fib Extension – blue). This is followed by $3325 (1.618 Fib Extension – red), $3400, $3500 (1.272 Fib Extension), and $3656 (1.414 Fib Extension).
On the other side, the first support lies at $3075. This is followed by $3000, $2825 (.236 Fib), $2700, and $2580 (.382 Fib).
The RSI is the highest it has been since early January 2021, indicating the momentum is very strong. It is overbought, which suggests that a brief retracement might be necessary – perhaps back to $3000.
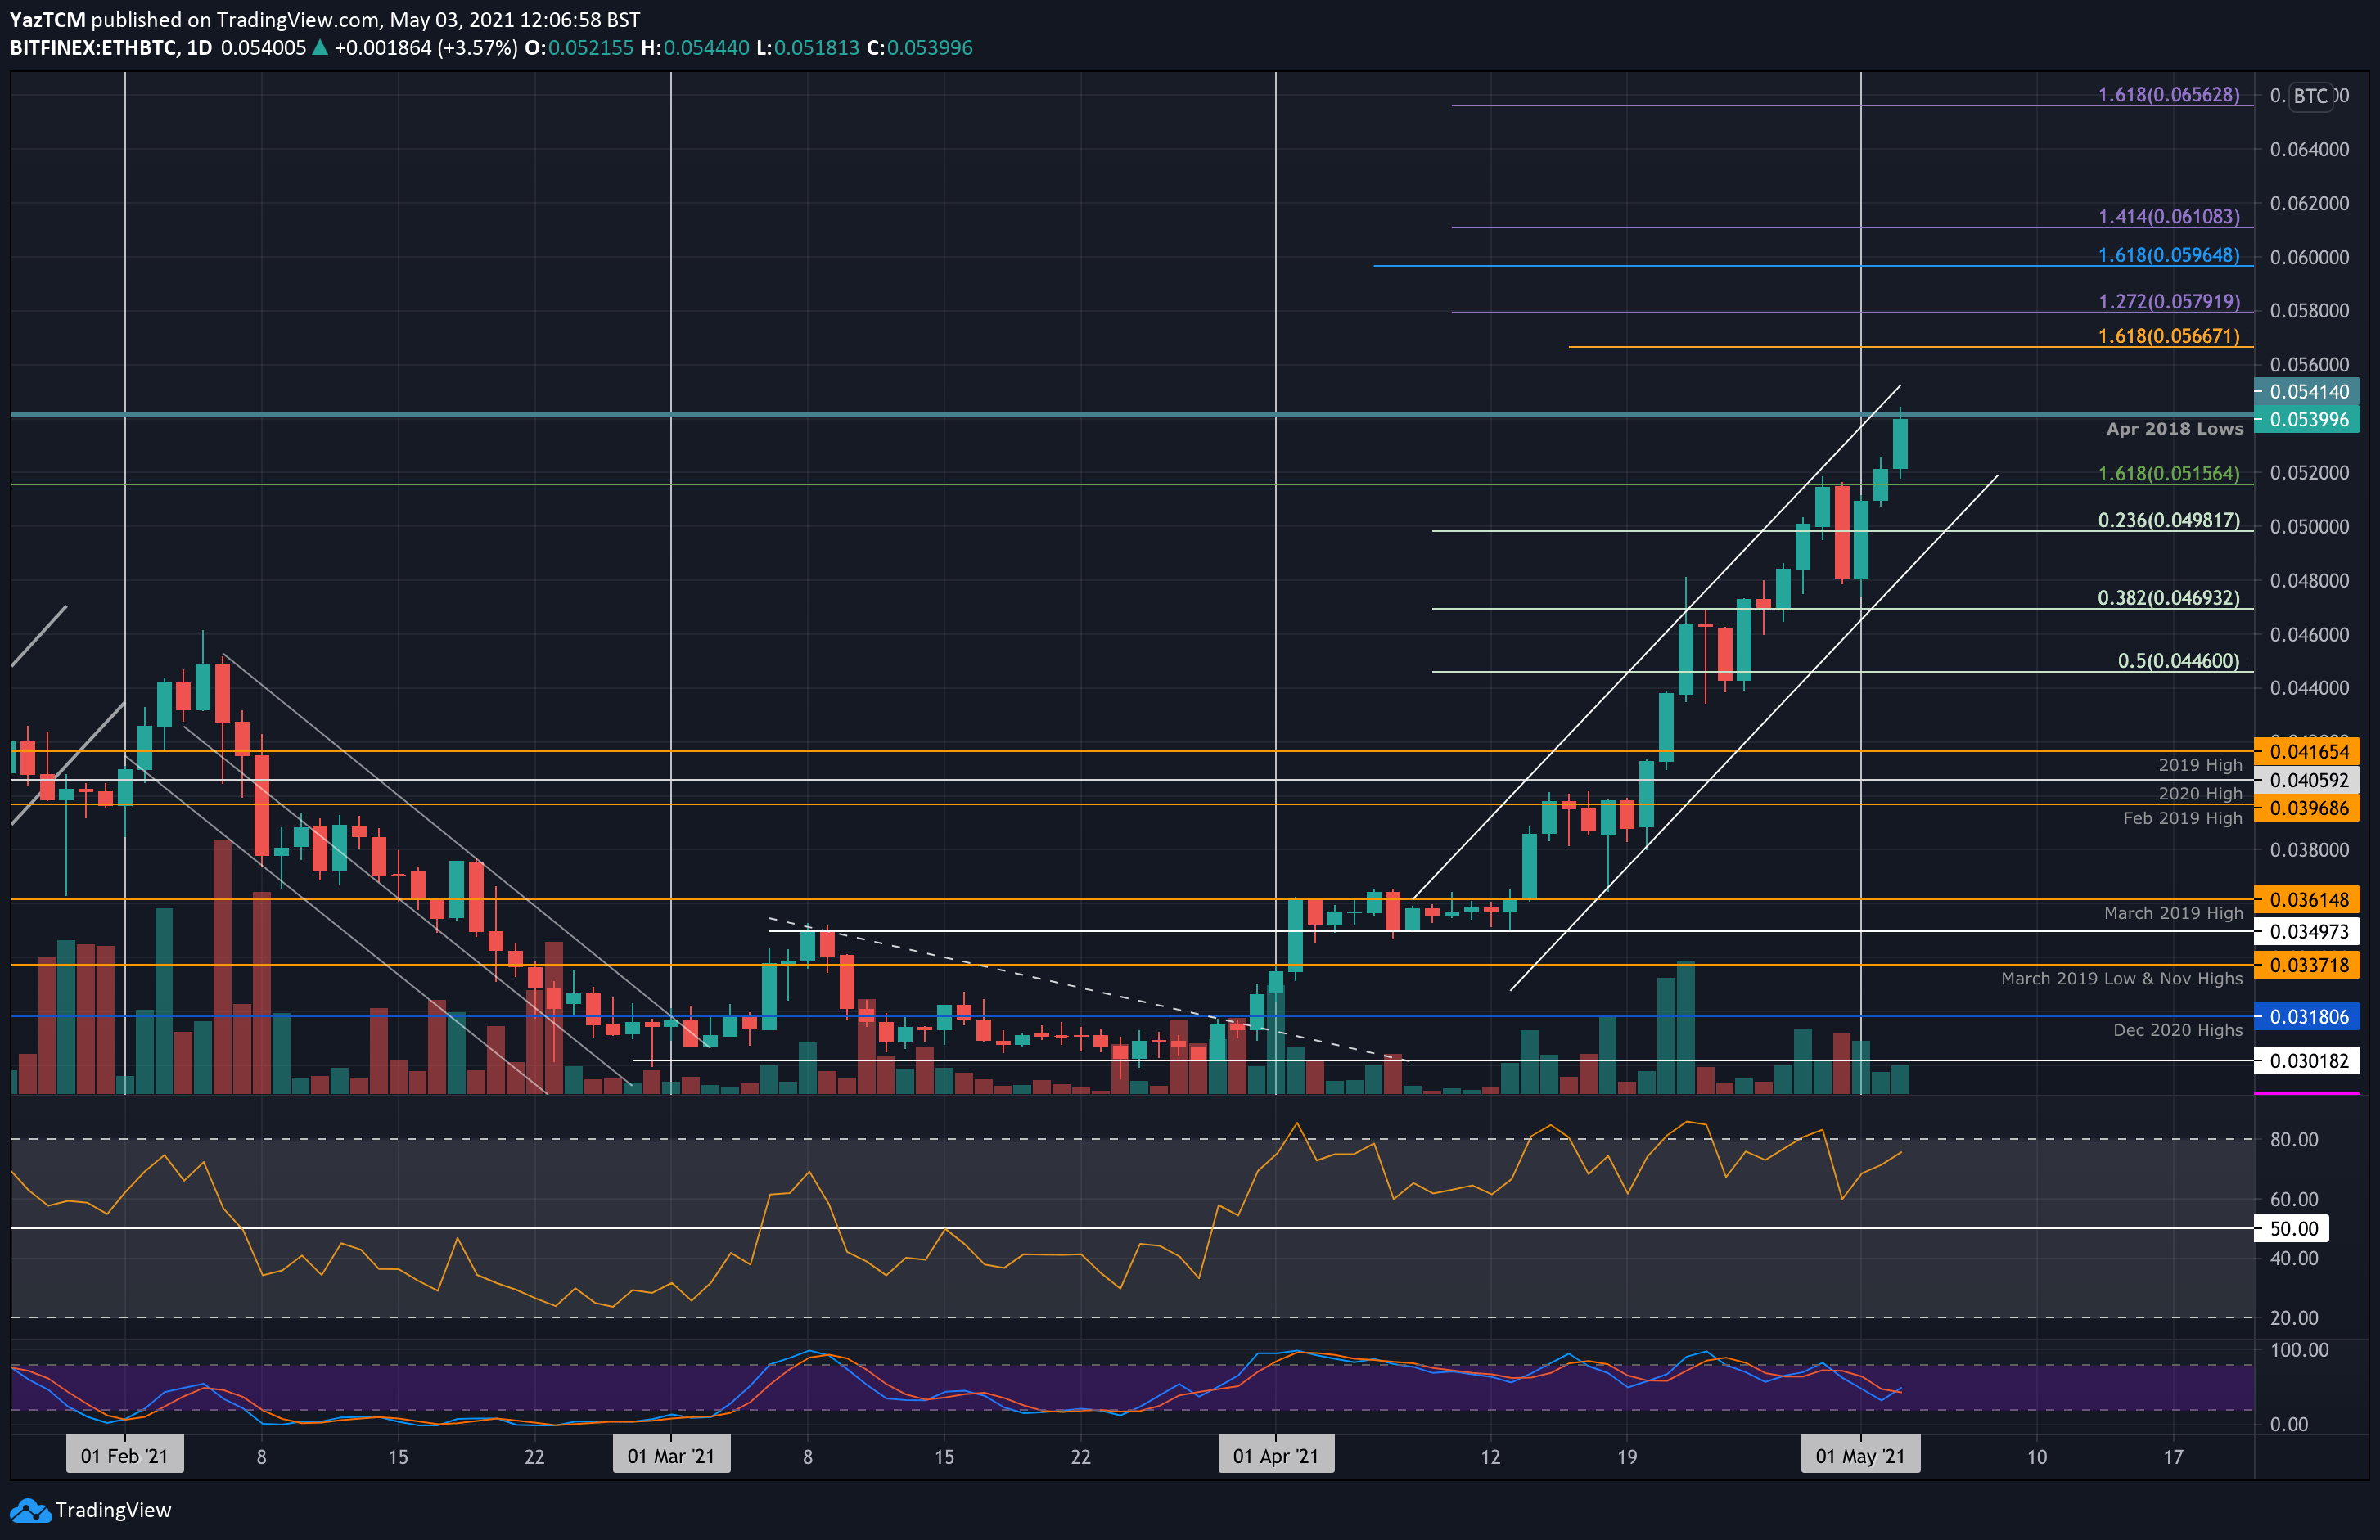
Key Support Levels: 0.0515 BTC, 0.05 BTC, 0.048 BTC.
Key Resistance Levels: 0.056 BTC, 0.0566 BTC, 0.058 BTC.
Ethereum has been trading inside an ascending price channel for the majority of the last month against bitcoin. The coin had reached resistance at 0.0515 BTC (1.618 Fib Extension) last Thursday and headed lower from there on Friday.
It managed to find support at 0.048 BTC and, by Saturday, ETH had already regained ground above 0.05 BTC. It continued beyond the 0.0515 BTC resistance yesterday and pushed well above 0.052 BTC today to reach the April 2018 lows around 0.054 BTC.
Looking ahead, once the bulls break 0.054 BTC, the first resistance lies at the upper boundary of the ascending price channel. This is followed by 0.056 BTC, 0.0566 BTC, 0.058 BTC (1.272 Fib Extension), and 0.06 BTC.
On the other side, the first support lies at 0.0515 BTC. This is followed by 0.05 BTC (.236 Fib), 0.048 BTC, and 0.0469 BTC (.382 Fib).
Worryingly, the RSI is showing hints of bearish divergence as it makes lower highs while the price makes higher highs. Typically, this is a signal for an imminent rollover which would see ETH heading back to the lower boundary of the price channel at 0.05 BTC.