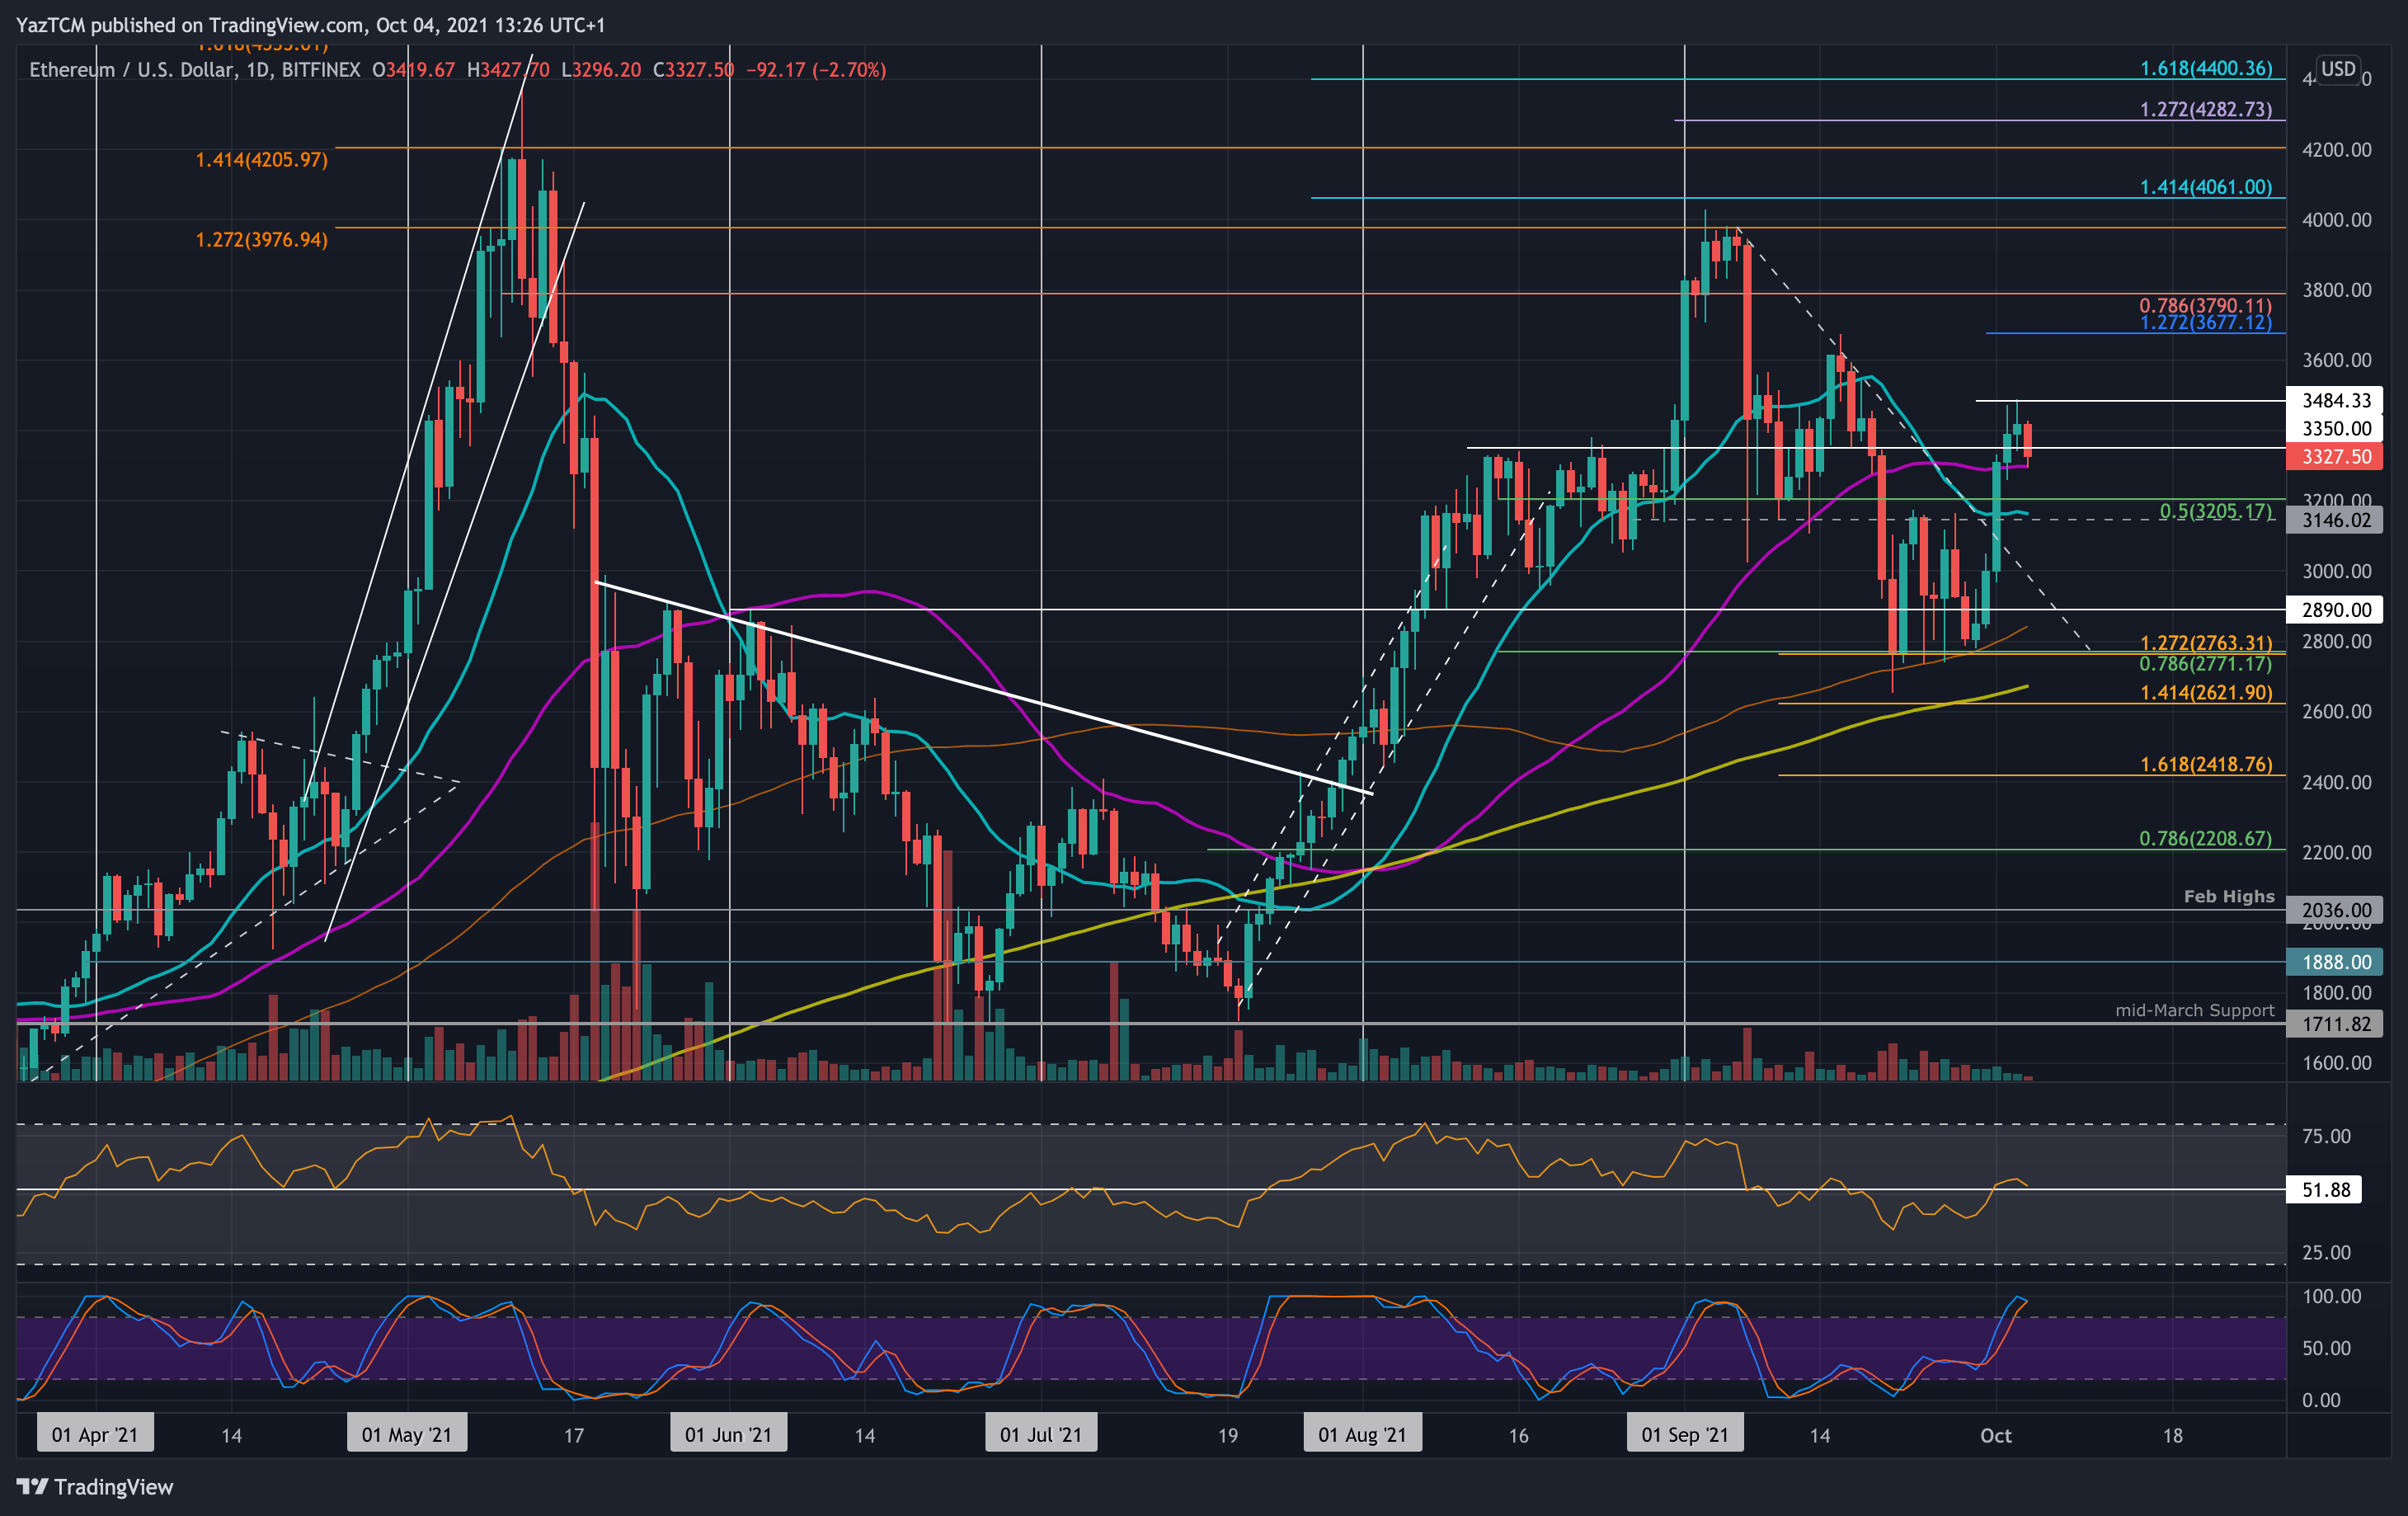
ETH/USD Daily Chart. Source: TradingView.
Key Support Levels: $3300, $3150, $3000.
Key Resistance Levels: $3600, $3790, $4000.x
Etheruem found support at $2770 (.786 Fib & 100-day MA) on Wednesday and has been increasing ever since. On Thursday, ETH managed to break a descending trend line as it passed the 20-day MA to reach the 50-day MA.
Over the weekend, ETH continued above the 50-day MA as it broke resistance at $3350 reach as high as $3485. It has since rolled over and is now using the 50-day MA as support.
Looking ahead, the first resistance lies at $3485. This is followed by $3600, $3790 (bearish .786 Fib Retracement), and $4000.
On the other side, the first support lies at the 50-day MA, around $3300. This is followed by $3150 (20-day MA), $3000, and $2890.
The RSI is back at the midline after climbing from beneath, indicating the previous bearish momentum has left the market.
Key Support Levels: 0.0691 BTC, 0.068 BTC, 0.067 BTC.
Key Resistance Levels: 0.07 BTC, 0.0711 BTC, 0.072 BTC.
Against BTC, the cryptocurrency is currently struggling to break resistance at 0.0711 BTC. The coin found support around 0.068 BTC last week and started to push higher over the weekend to break the 50-day MA and reach as high as 0.072 BTC.
Unfortunately, ETH failed to close a daily candle above 0.0711 BTC and ended up rolling over from there yesterday to fall back beneath 0.07 BTC today and reach 0.0691 BTC.
Moving forward, the first support lies at 0.0691 BTC. This is followed by 0.068 BTC, 0.067 BTC (100-day MA), and 0.0659 BTC (.618 Fib).
On the other side, the first resistance lies at 0.07 BTC. This is followed by 0.0711 BTC, 0.072 BTC, and 0.0733 BTC.
The daily RSI is still beneath the midline, indicating weak bearish momentum in the market.