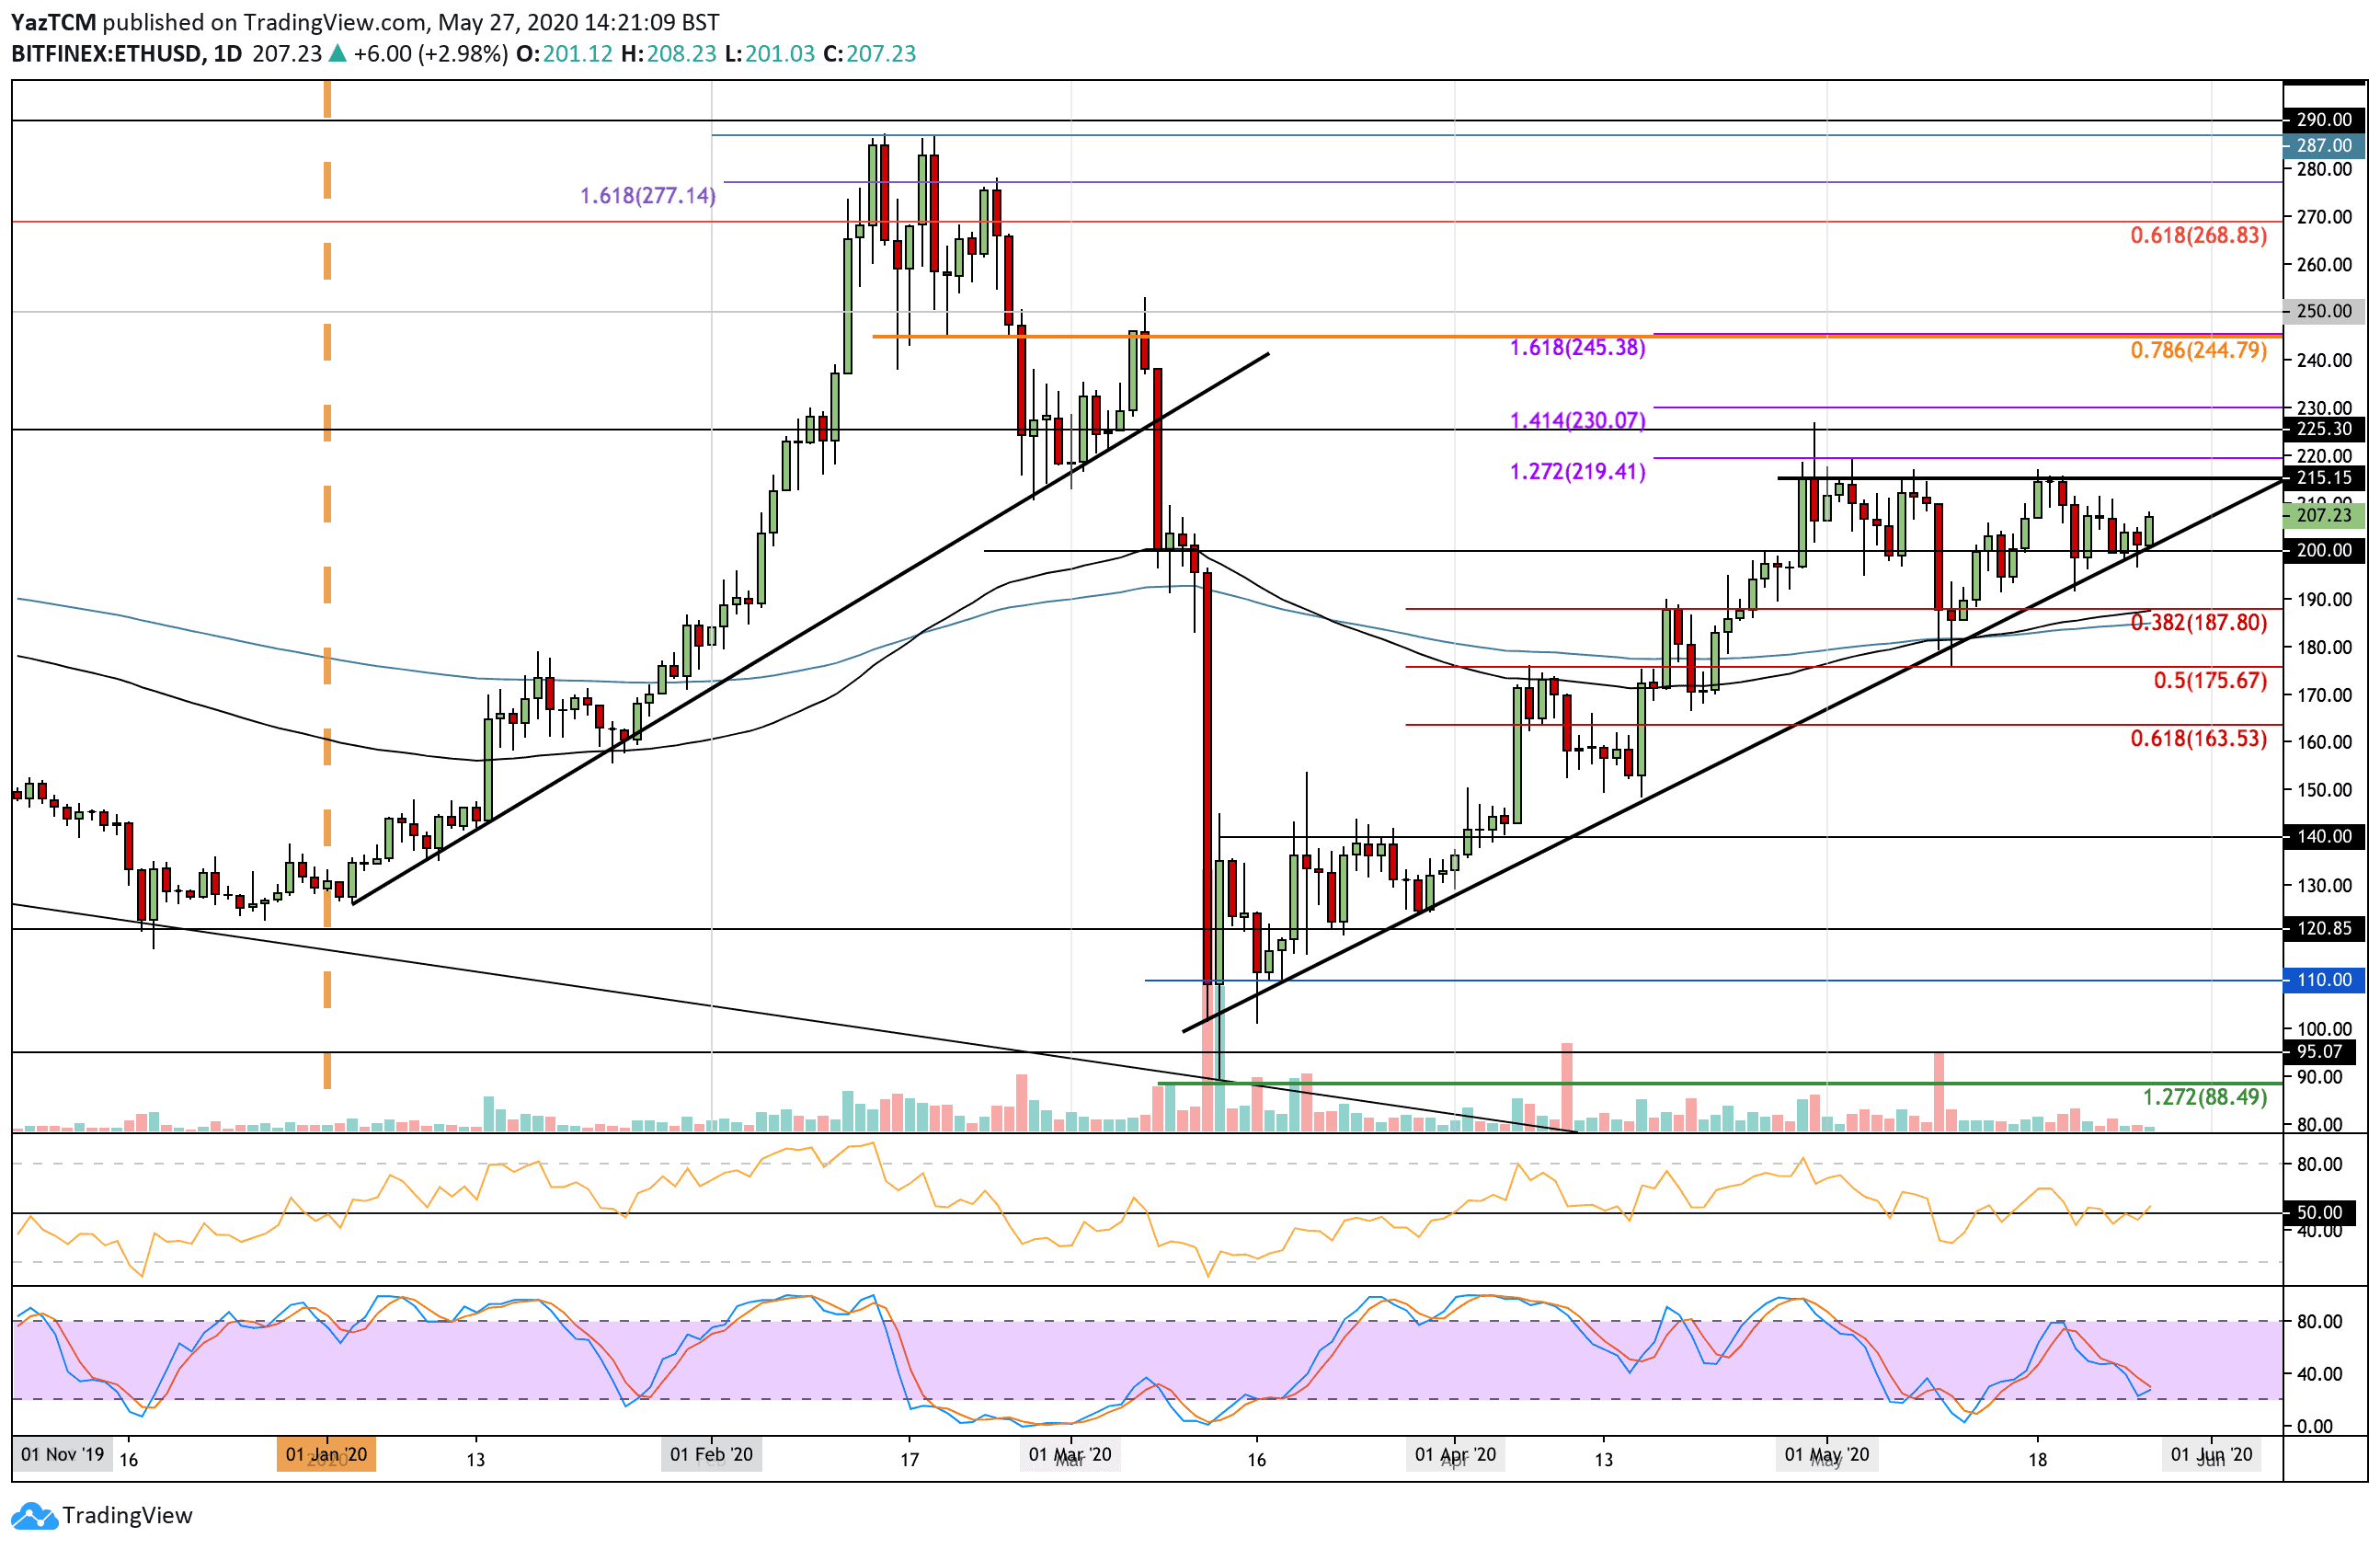
ETH/USD:
Support: $200, $187, $180.
Resistance: $215, $220, $225.
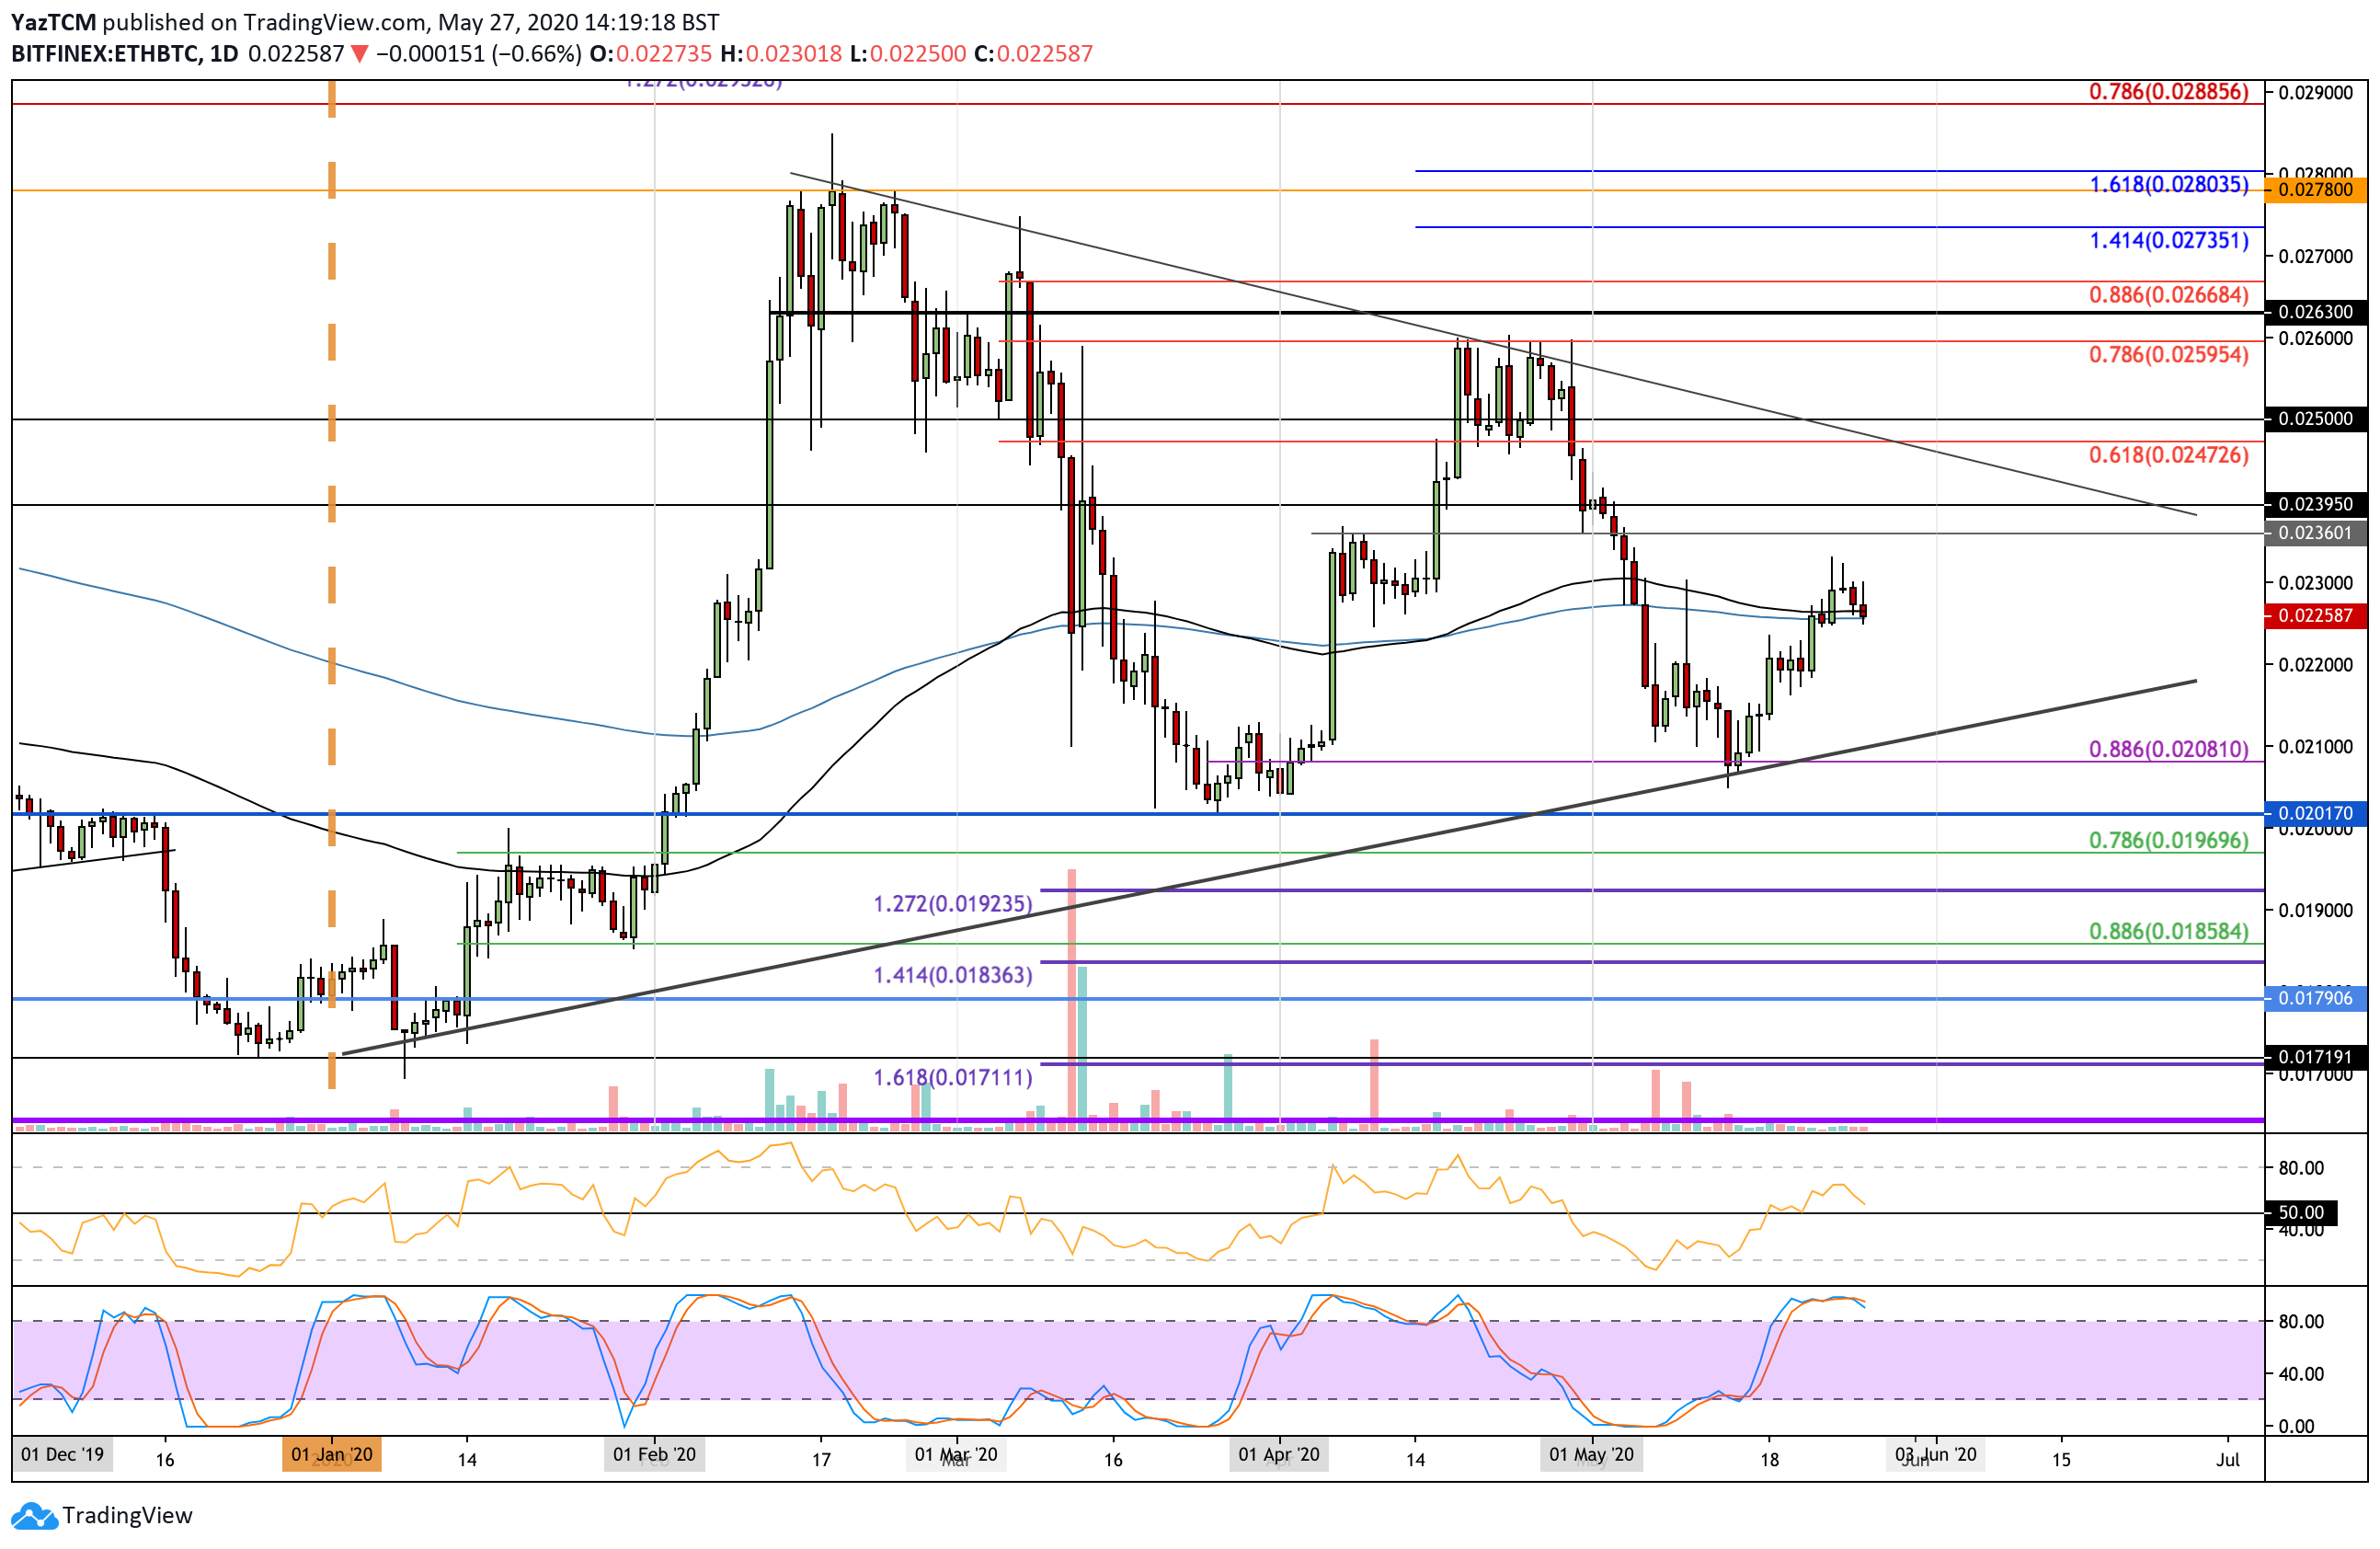
ETH/BTC:
Support: 0.022 BTC, 0.0215 BTC, 0.021 BTC.
Resistance: 0.023 BTC, 0.0236 BTC, 0.024 BTC.
Ethereum rebounded from the $200 level today to reach as high as $208 with a 3% price increase. The cryptocurrency almost fell beneath the rising trend line, but the buyers are doing well to keep it above.
This rebound has caused ETH to start the formation of an ascending triangle pattern with the roof at $215. If the bulls can push and close above the upper boundary, then Ethereum has the potential to rally toward $250.
The first level of strong resistance is located at the upper boundary of the triangle at $215. Above this, resistance lies at $220 (1.272 Fib Extension), $225, and $230 (1.414 Fib Extension). Additional resistance is then located at $245 (bearish .786 Fib Retracement).
On the other side, the first level of support lies at the rising trend line. Beneath this, support is expected at $200, $190 (100-days EMA & .382 Fib Retracement), $187 (200-days EMA), and $176 (.5 Fib Retracement).
The RSI has poked itself marginally above the 50 line as the buyers start to take control. If it can continue to rise, then the bullish momentum will grow and push ETH toward the $215 level. Additionally, the Stochastic RSI is primed for a bullish crossover signal that should help the bullish pressure to increase.
Against Bitcoin, Ethereum had rebounded from the 0.0208 BTC level earlier last week and started to push higher. It went on to break above the 200-days EMA at 0.0225 BTC and pushed toward 0.023 BTC.
Unfortunately, ETH was unable to close above 0.023 BTC, which caused the coin to drop slightly back into the support at the 200-days EMA at 0.0225 BTC.
If the sellers push beneath the 200-days EMA, support lies at 0.022 BTC, 0.0215 BTC, and the rising trend line. Beneath this, added support is found at 0.021 BTC and 0.0208 BTC.
Alternatively, if the buyers can rebound from the 200-days EMA, the first level of resistance lies at 0.023 BTC. Above this, resistance is expected at 0.0236 BTC, 0.024 BTC, and the falling trend line at around 0.0242 BTC.
The RSI has recently dipped lower to indicate falling bullish momentum. If it drops beneath the 50 line, the bears will take control, and ETH is likely to head toward 0.022 BTC. Additionally, the Stochastic RSI produced a bearish crossover signal in overbought conditions, which is a strong selling signal.