Ethereum has decreased by a total of 5% over the past 3 days after it managed to surge by over 35% from low to high in September. Etheruem saw a further 2% price drop today which brought its price down to $208. Despite the recent declines, Ethereum is still up by a total of 12% over the past week and it now rests at the 100-days EMA.
Ethereum remains the second-largest cryptocurrency with a market cap of $22.86 billion.
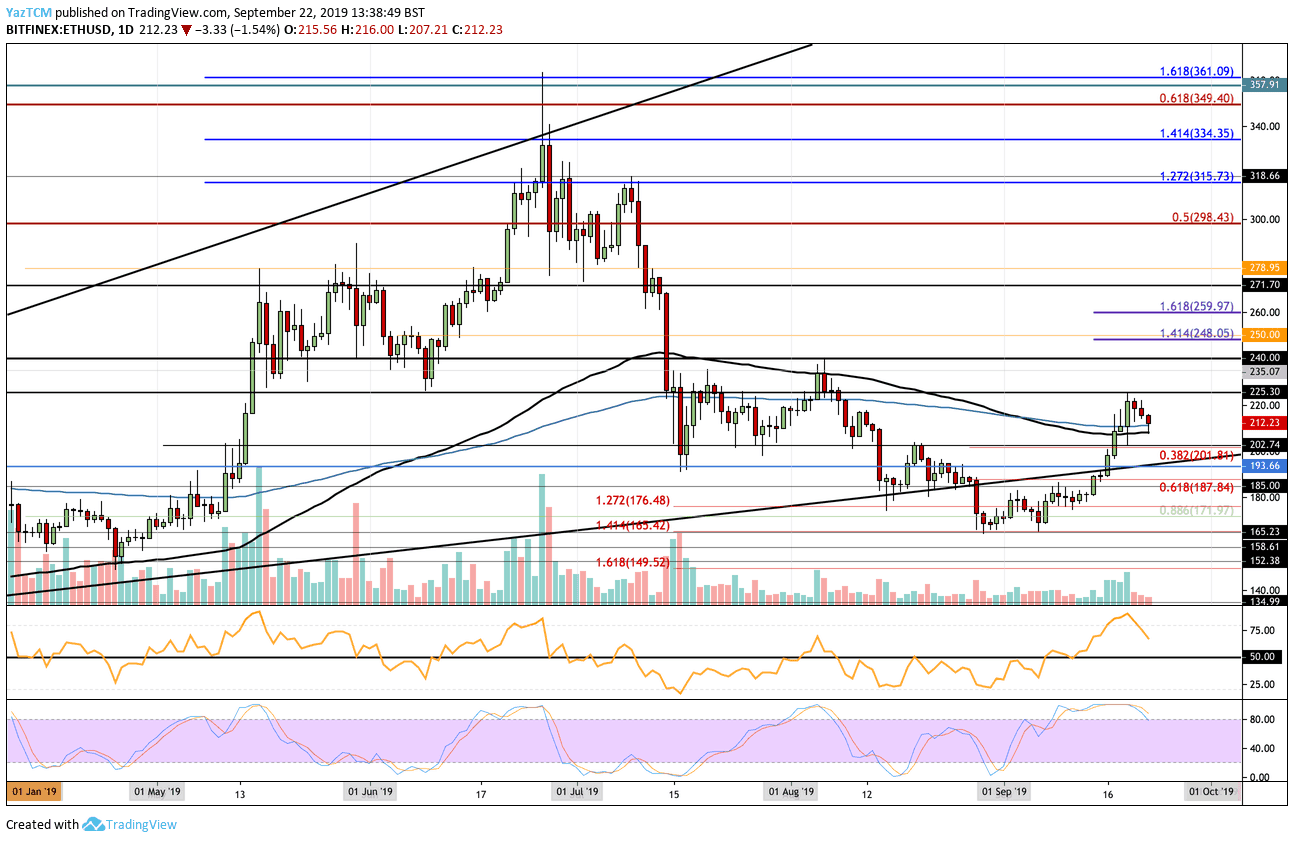
Looking at the ETH/USD 1-day chart:
- Since our previous ETH/USD analysis, Ethereum continued to surge above $200 and broke above the congestion at the 100-days and 200-days EMA to reach the resistance at $225.30. However, it has since rolled over and it rests at the 100-days EMA.
- From above: The nearest level of resistance lies at $225. Above this, resistance is found at $235, $240, $248, and $250. Higher resistance above $250 is located at $259.97 (1.618 Fib Extension), $271.70, $278.95, and $298.43 (bearish .5 Fib Retracement).
- From below: The nearest level of support lies near to where the market is currently trading at $208(provided by 100-days and 200-days EMA). Beneath this, support is located at $201.91, $200, $193.66, and $187.82 (short term .618 Fib Retracement). Support below that is expected at $180, $171.97, and $165.23.
- The trading volume has increased during September but has started to fall over the past 3 days.
- The RSI has slipped from overbought conditions but remains above the 50 level. If the RSI can hold the 50 level, we can expect ETHUSD to rebound at $200 or $187. Similarly, the Stochastic RSI has provided a bearish crossover signal as we anticipate a small retracement toward $201 or $187.
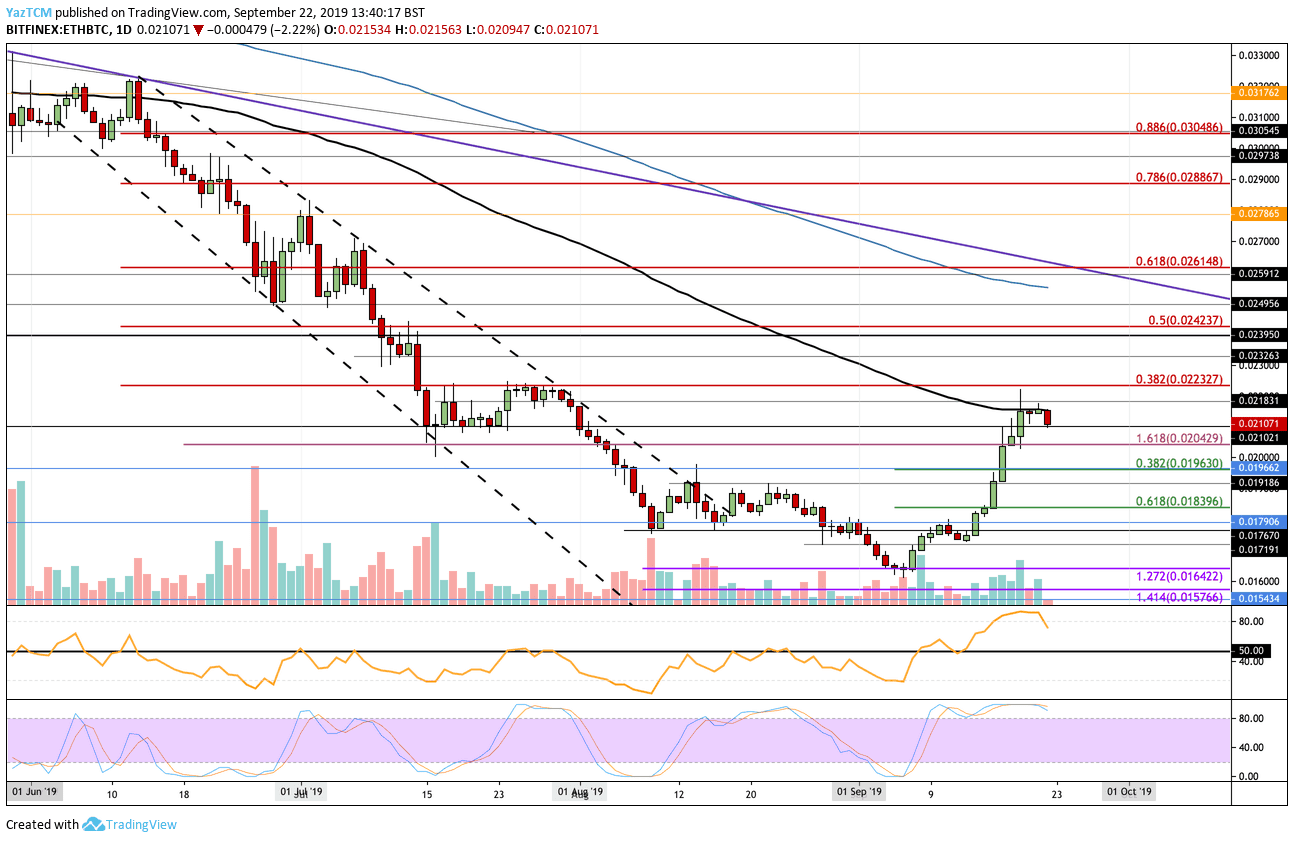
Looking at the ETH/BTC 1-day chart:
- Against BTC, Ethereum soared above the resistance at 0.02 BTC and continued to go further before bumping into resistance around 0.02160 BTC which is provided by the 100-days EMA. ETH now rests at support around 0.021 BTC.
- From above: The nearest level of resistance lies at 0.02160 BTC (100-days EMA). Above this, resistance is located at 0.02183 BTC, 0.022 BTC, and 0.02232 (bearish .382 Fib Retracement). Higher resistance is expected at 0.02326 BTC, 0.02395 BTC, and 0.02423 BTC (bearish .382 Fib Retracement).
- From below: The nearest level of support lies at 0.021 BTC. Beneath this, support lies at 0.0204 BTC, 0.020 BTC, 0.01936 BTC (short term .382 Fib Retracement), 0.019 BTC, and 0.018396 BTC (.618 Fib Retracement).
- The trading volume has seen a bump during September but has started to decrease.
- The RSI has slipped from overbought conditions as it makes its way toward the 50 level. Furthermore, the Stochastic RSI is in the process of creating a bearish crossover signal as we anticipate a retracement toward 0.020 BTC, or perhaps even lower toward 0.01829 BTC.
SPECIAL OFFER (Sponsored)
LIMITED OFFER 2024 for CryptoPotato readers at Bybit: Use this link to register and open a $500 BTC-USDT position on Bybit Exchange for free!
Disclaimer: Information found on CryptoPotato is those of writers quoted. It does not represent the opinions of CryptoPotato on whether to buy, sell, or hold any investments. You are advised to conduct your own research before making any investment decisions. Use provided information at your own risk. See Disclaimer for more information.
Cryptocurrency charts by TradingView.