Ethereum is currently trading very close to the $200 level as the bulls attempt to gain some form of stabilization after the precipitous 35% drop seen earlier this month. Moreover, trading against BTC, Ethereum is showing some promising signs.
Ethereum remains the second-largest cryptocurrency by market value, with a market cap of $22.28 billion.
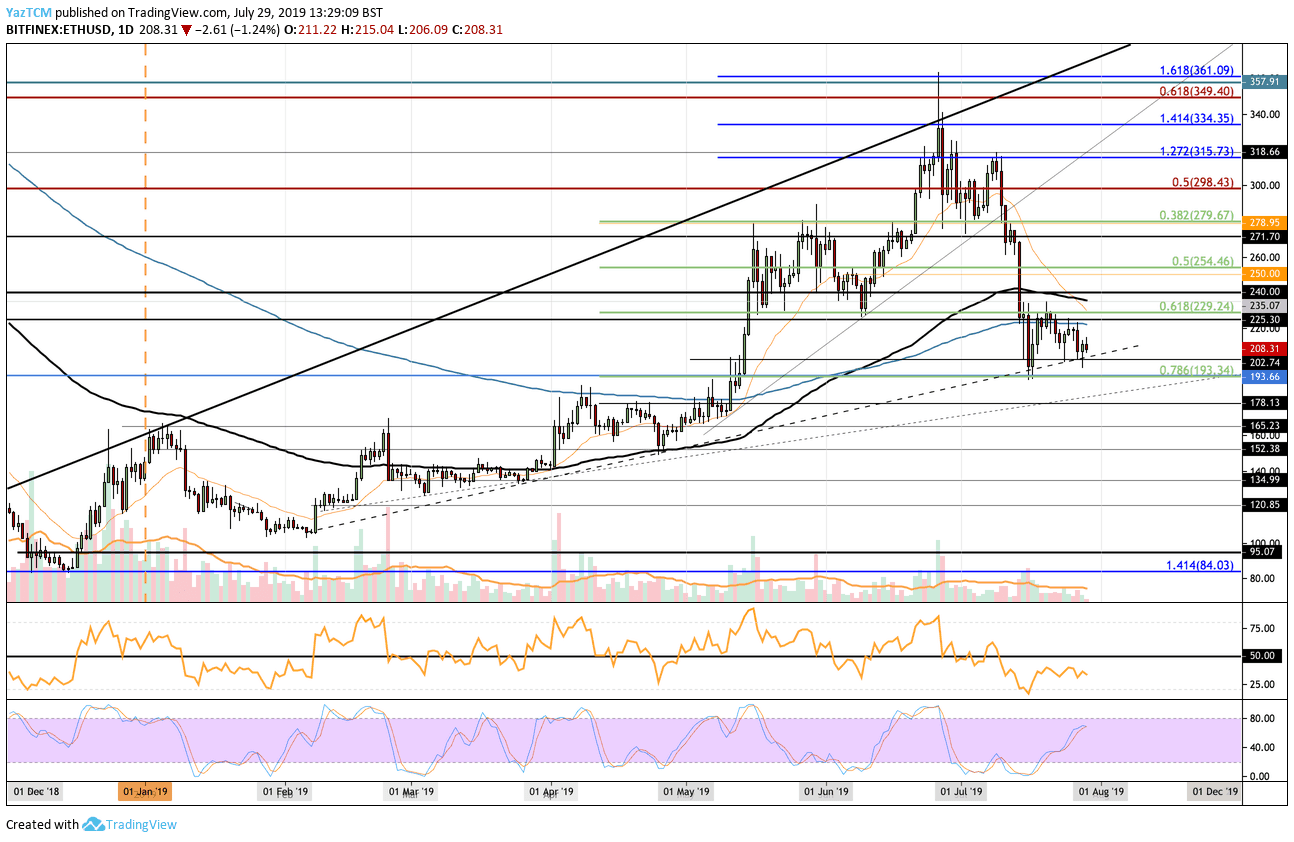
Looking at the ETH/USD 1-day chart:
- Since our previous ETH/USD analysis, the resistance at $230 proved too strong and caused ETH to roll over again. Ethereum has found support at a rising trend line and has been trapped between $193 and $230 for the past 2 weeks.
- From above: The nearest level of resistance lies at $225. That’s where the 200-day EMA is located. Above this, higher resistance lies at $230 and $235 (which contains the 100-day EMA). If the price climbs above $240, the next levels of resistance will be found at $254, $270, $279, and $300.
- From below: The nearest levels of support lie at the rising dashed support trend line and the $200 level. If the sellers push Ethereum’s price beneath $200, further support is located at $193 (.786 Fib retracement). Beneath $193 we can expect lower support at $178, $165, $160 and $150.
- The trading volume has flattened as the month has progressed.
- The RSI remains below 50, which indicates that the sellers remain in control of the market. For a recovery to occur, we will need to see the RSI break back above 50.
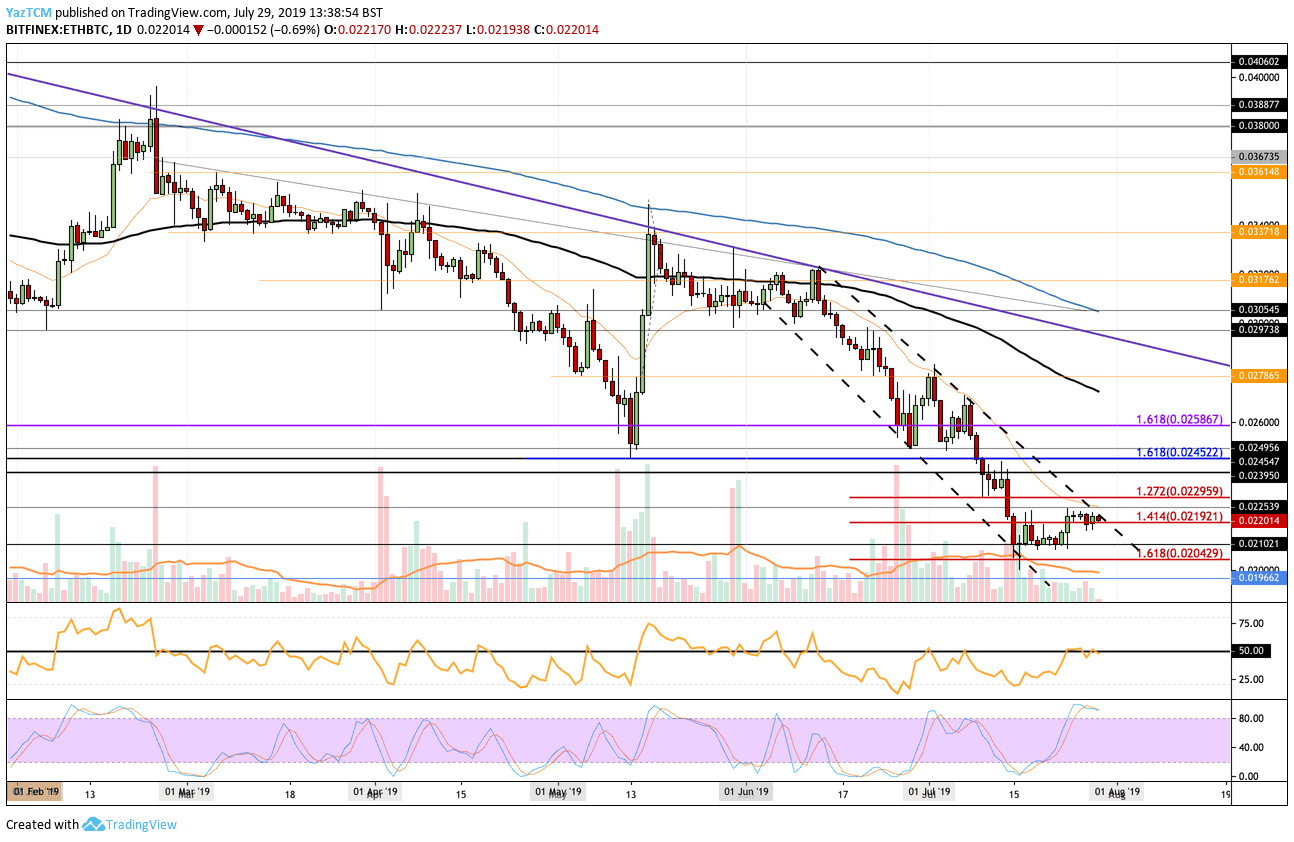
Looking at the ETH/BTC 1-day chart:
- Ethereum’s Bitcoin market is attempting a comeback. The support at 0.021 BTC has held very well, allowing ETH/BTC to rebound to 0.022 BTC. However, ETH remains in a very steep downward channel as it struggles to break above its upper boundary.
- From above: The nearest level of resistance lies at the upper boundary of the aforementioned channel. Above this, higher resistance lies at 0.0225 BTC and 0.0023 BTC. If the bulls continue above the resistance at 0.024 BTC, higher resistance can be found at 0.0245 BTC and 0.026 BTC.
- From below: The nearest level of support now lies at 0.02192 BTC. Beneath this, further support lies at 0.021 BTC and 0.0204 BTC.
- The trading volume has steadily decreased during July.
- The RSI currently rests at the 50 level which shows indecision in the market. If the RSI can break above 50, this will be a promising sign for ETH bulls. However, the Stochastic RSI recently produced a bearish crossover signal which could potentially signal that the bears are ready for another move lower.
SPECIAL OFFER (Sponsored)
Binance Free $600 (CryptoPotato Exclusive): Use this link to register new account and receive $600 exclusive welcome offer on Binance (
full details).
LIMITED OFFER 2024 for CryptoPotato readers at Bybit: Use this link to register and open a $500 BTC-USDT position on Bybit Exchange for free!
Disclaimer: Information found on CryptoPotato is those of writers quoted. It does not represent the opinions of CryptoPotato on whether to buy, sell, or hold any investments. You are advised to conduct your own research before making any investment decisions. Use provided information at your own risk. See Disclaimer for more information.
Cryptocurrency charts by TradingView.