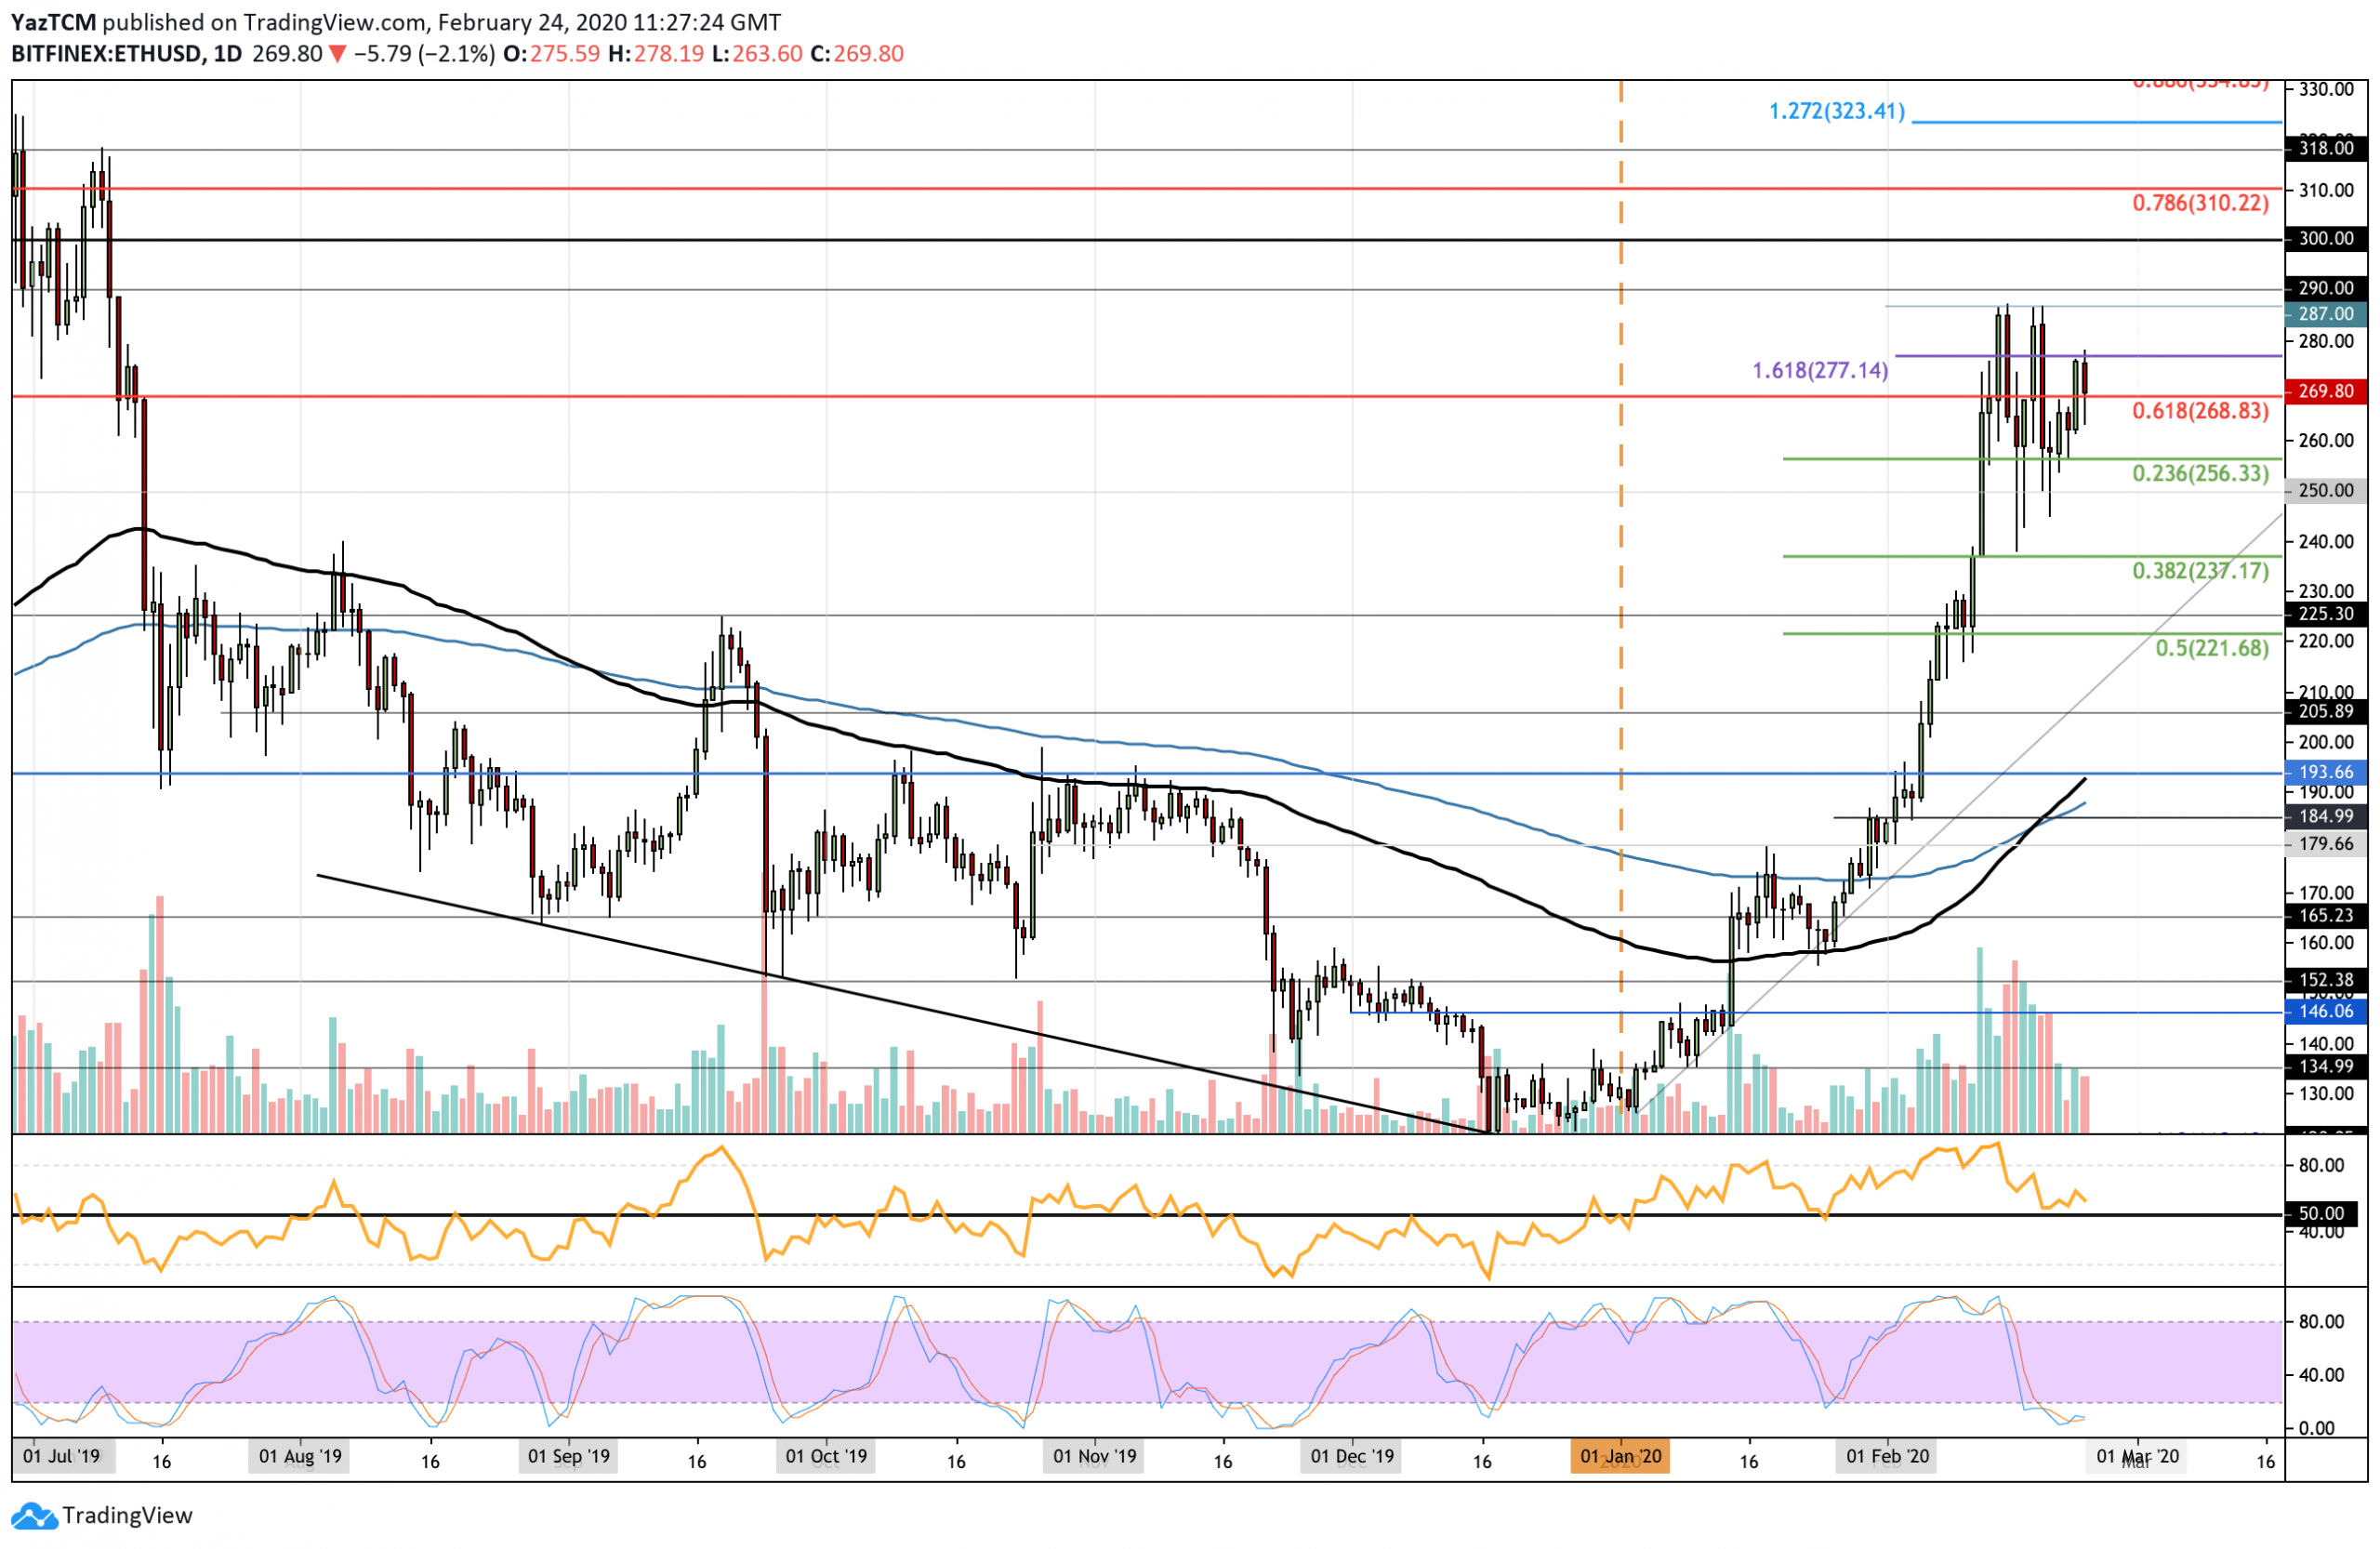
ETH/USD:
Support: $255, $250, $240.
Resistance: $275, $285, $290.
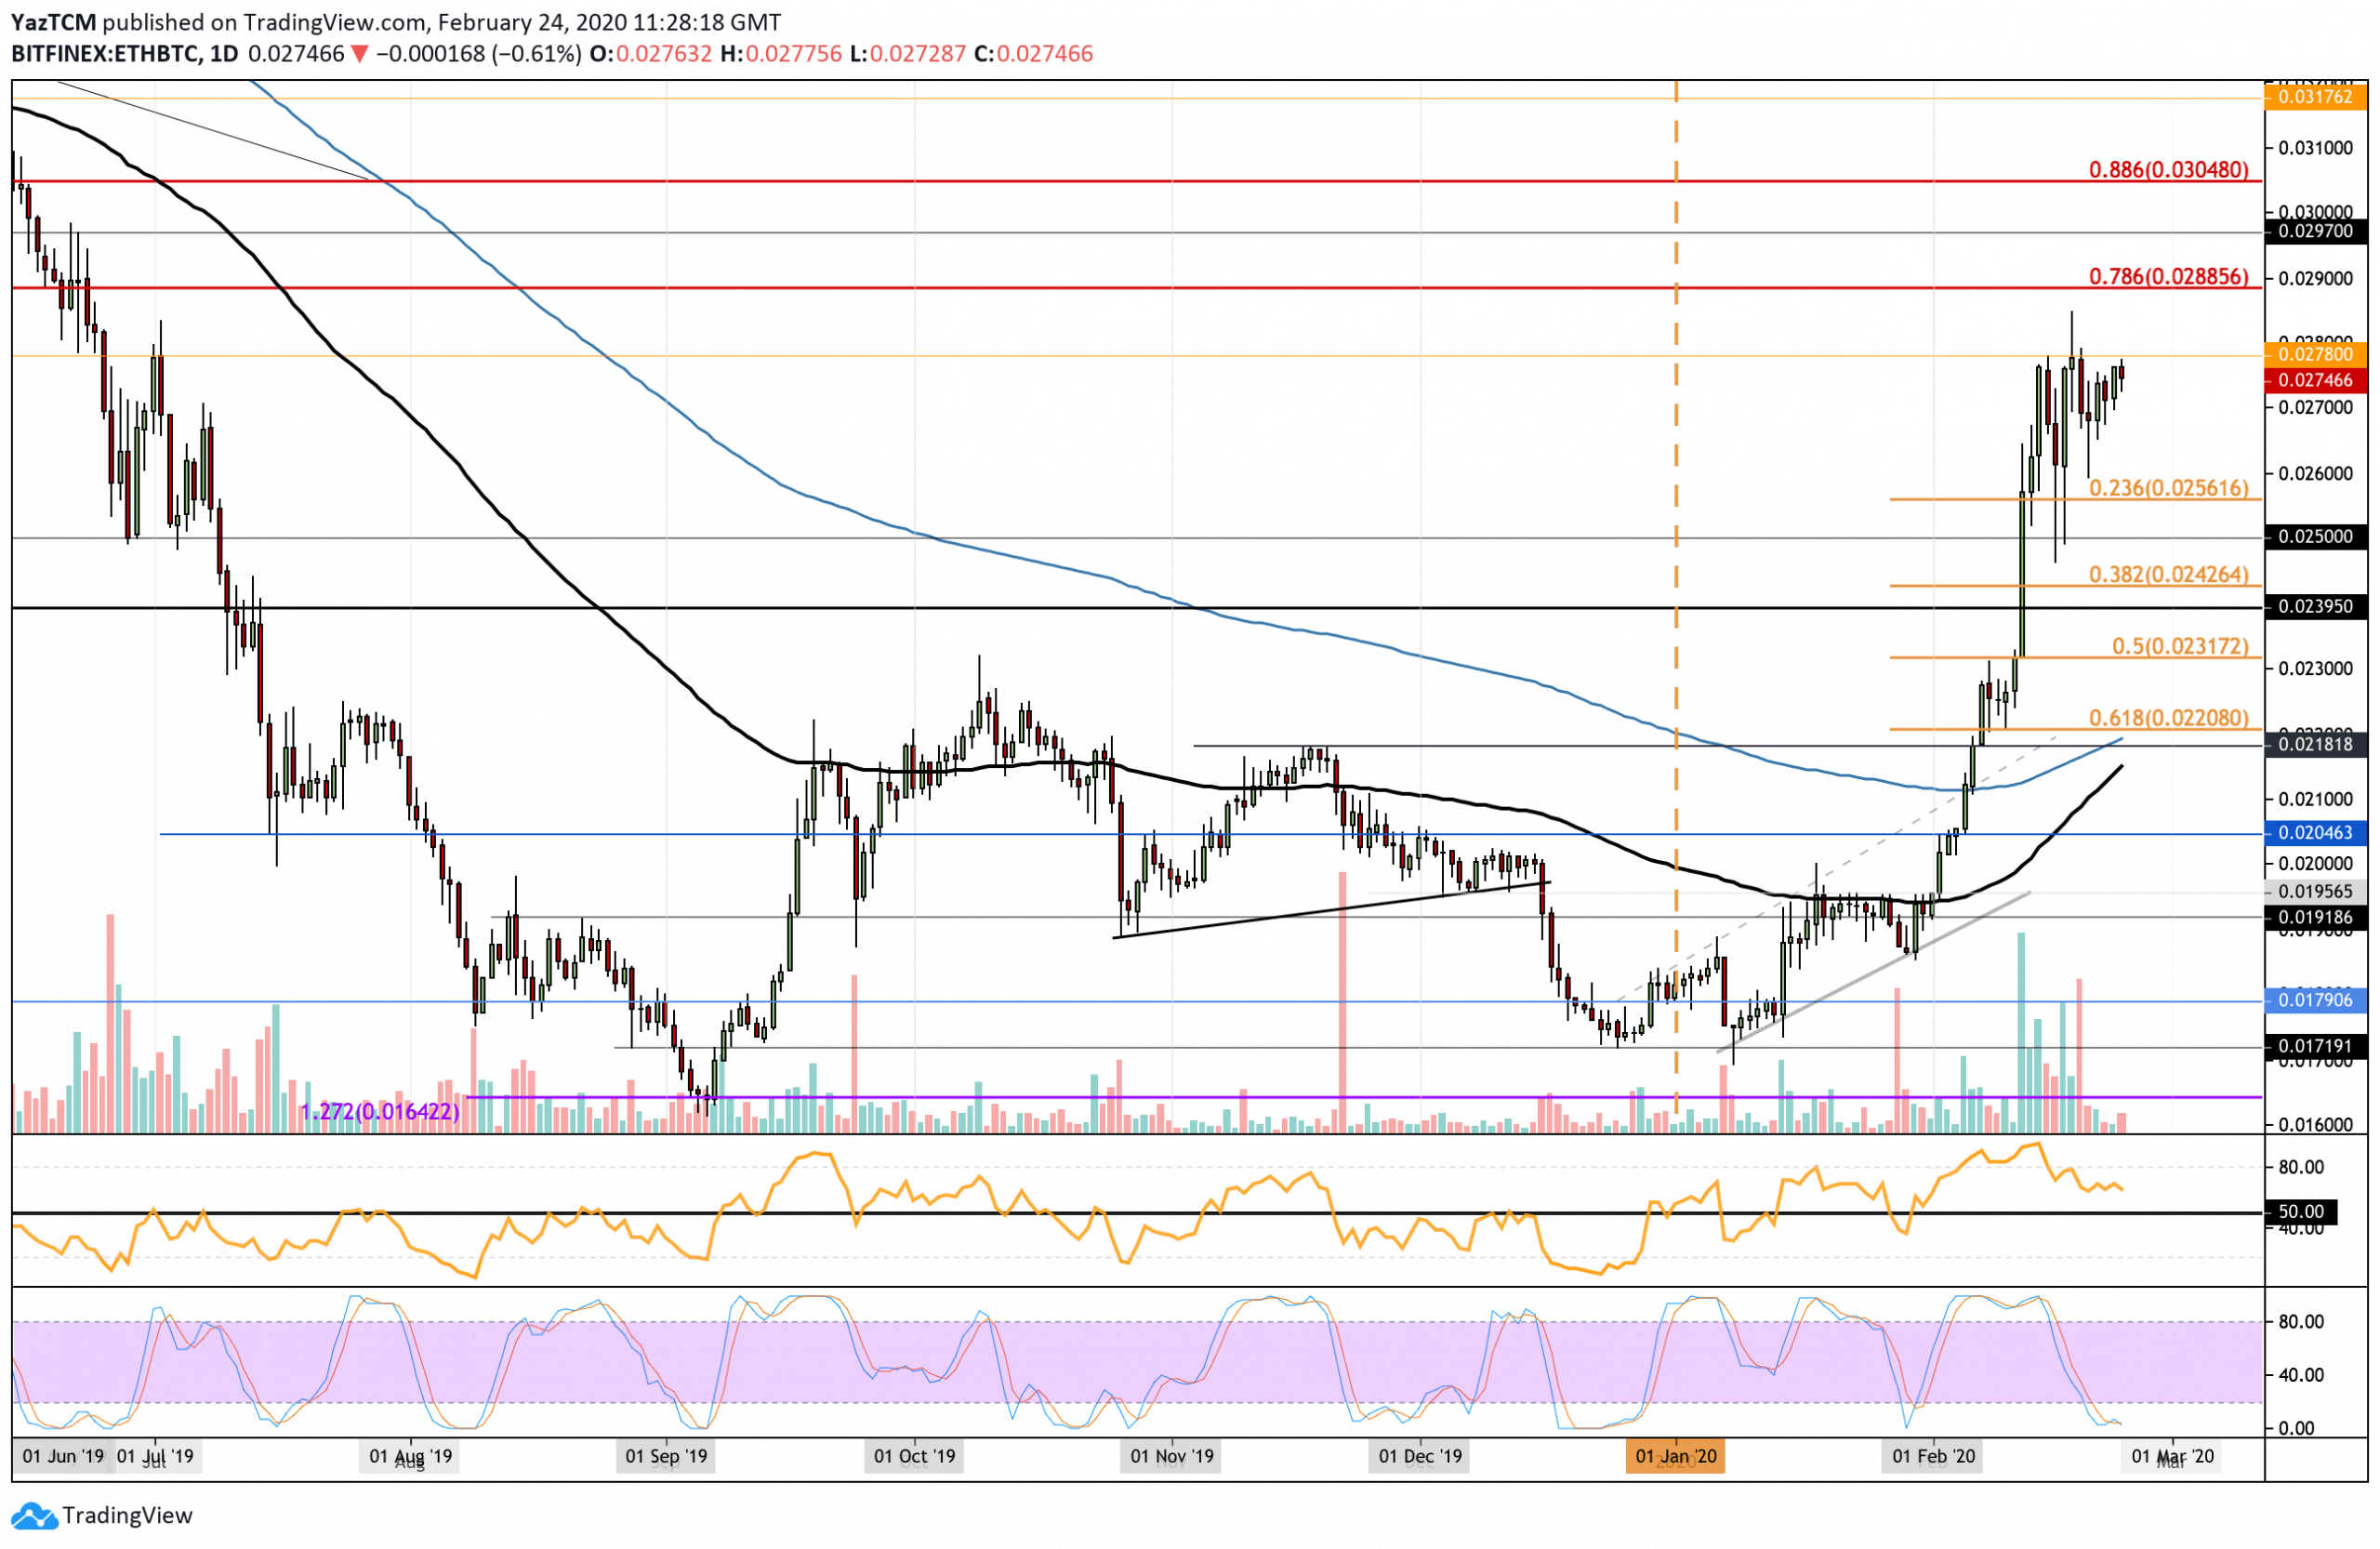
ETH/BTC:
Support: 0.026 BTC, 0.0256 BTC, 0.025 BTC.
Resistance: 0.0278 BTC, 0.0288 BTC, 0.030 BTC .
Since our last analysis, Ethereum continued to bounce higher from the $255 support level but failed to overcome the resistance at $275. If the market closes today as it is, this will create a lower high, putting ETH in a phase of confirmed consolidation.
A period of consolidation is necessary, especially after ETH managed to increase by a total of 127% from low to high in 2020. It allows the buyers to take a break without forfeiting control to the sellers as the market moves sideways within a defined range.
ETH would need to collapse beneath $235 to invalidate any period of consolidation and make the market turn bearish.
If the sellers break beneath $260, the first levels of support lie at $255 and $250. Beneath this, additional support lies at $240 and $235.
On the other hand, if the buyers can break $275, we can expect higher resistance at $285, $290, and $300.
The RSI is declining, which indicates a fading bullish momentum. However, as it is still above 50, it suggests that the bears are still not in control. Additionally, the Stochastic RSI is in extremely oversold conditions and has been here for the longest period in 2020. A bullish crossover signal would help to push ETH back higher.
Against Bitcoin, ETH continues to struggle at the 0.0278 BTC region. It found support at 0.026 BTC and started to rebound higher until reaching the resistance above.
The cryptocurrency is starting to form an ascending triangle pattern with the “roof” at 0.0278 BTC.
A break above would help to push ETH out of the consolidation phase. But a break beneath 0.025 BTC could put ETH in danger of turning bearish.
If the buyers can finally break 0.0278 BTC, the first level of resistance lies at 0.028 BTC. This is followed by resistance at 0.0288 BTC (bearish .786 Fib Retracement) and 0.030 BTC.
On the other hand, if the sellers roll over again, the first level of support lies at 0.026 BTC. Additional support lies at 0.0256 BTC (.236 Fib Retracement), 0.025 BTC, and 0.0242 BTC (.382 Fib Retracement).
The RSI is slowly flattening out. This shows that, although the bulls are moving sideways, the sellers are still nowhere to be seen, which creates a very promising scenario for ETH/BTC. Additionally, the Stochastic RSI is also in oversold conditions and is primed for a bullish crossover signal.