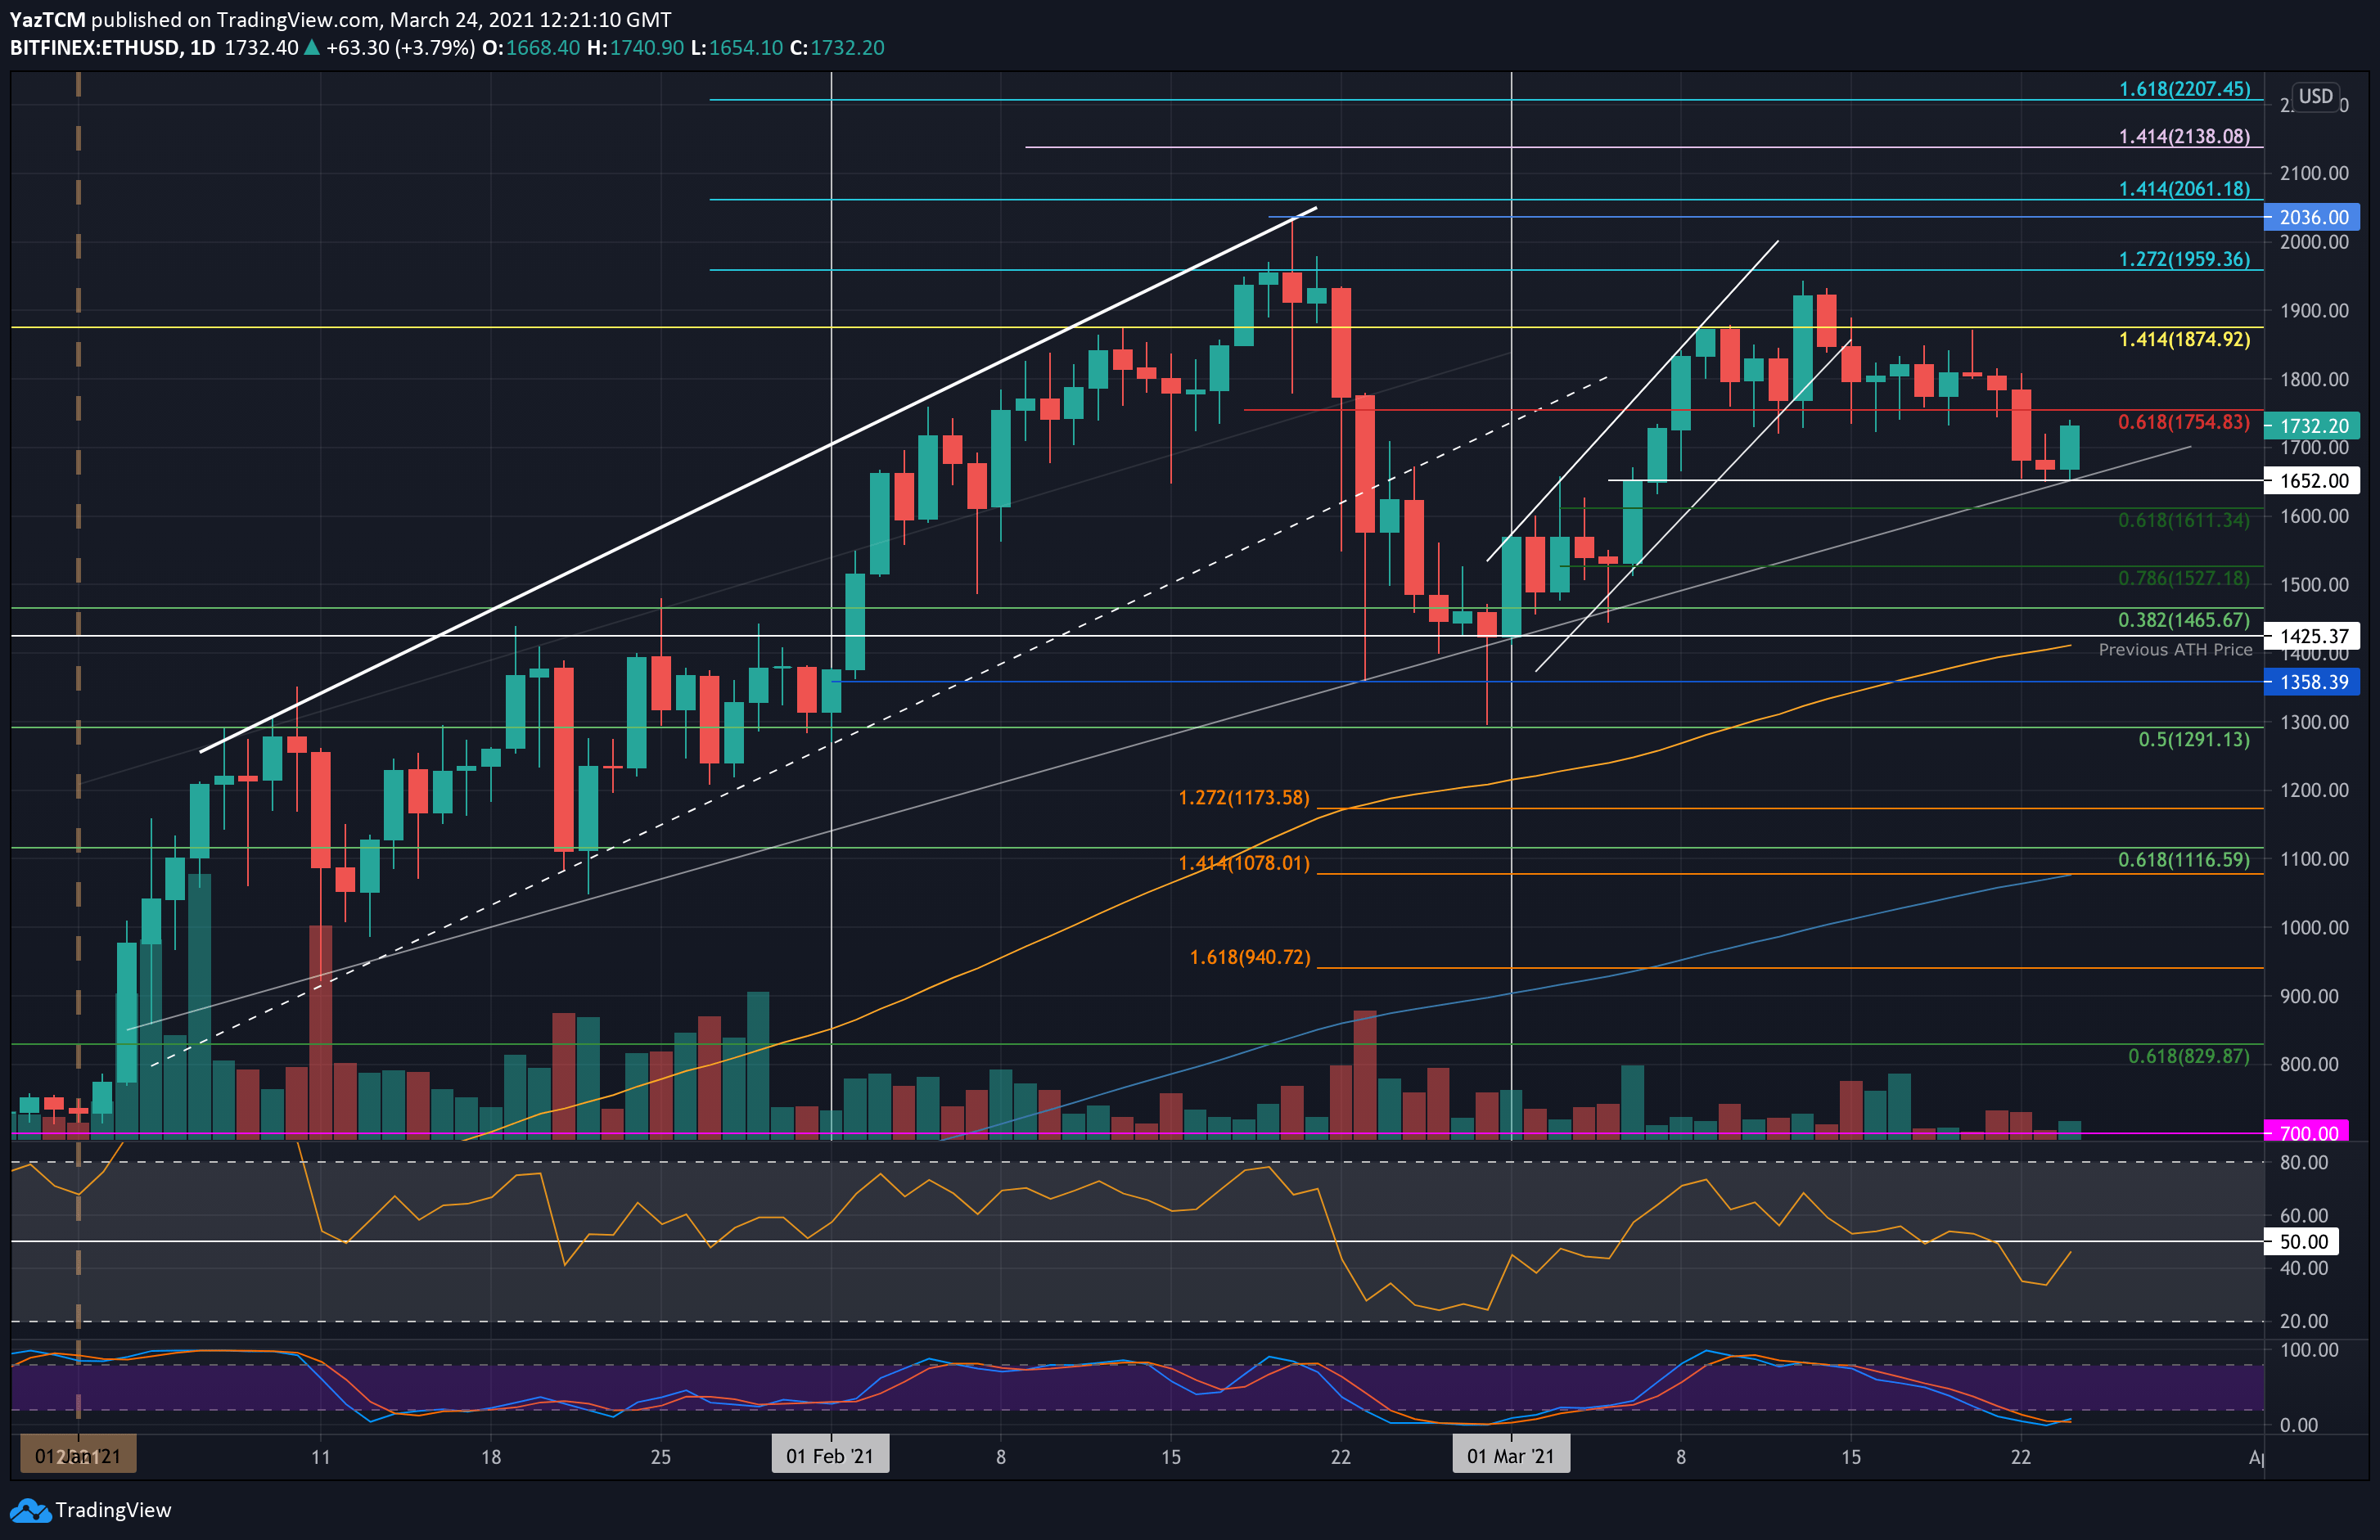
ETH/USD Daily Chart. Source: TradingView
Key Support Levels: $1652, $1610, $1527.
Key Resistance Levels: $1755, $1800, $1875.
Over the past week, Etheruem had been trading within a range between $1875 and $1755. This range was penetrated toward the downside on Monday as the coin dropped beneath $1700 to reach support at $1652.
This support was further bolstered by an ascending trend line that dates back to early January. After hitting this support, Ethereum bounced higher to climb back above $1700 and hit $1732 today.
Looking ahead, the first level of resistance is expected at $1755 (bearish .618 Fib Retracement). This is followed by $1800, $1875 (1.414 Fib Extnesion), and $1960 (1.272 Fib Extension and all-time high daily closing price).
On the other side, the first support lies at $1652. Beneath this, support lies at $1610 (.618 Fib), $1527 (.786 Fib), and $1425 (early March support & 100-days EMA).
The RSI has started to push higher from beneath 40 as it heads toward the midline. This indicates the previous bearish momentum is starting to fade. Additionally, the Stochastic RSI is primed for a bullish crossover signal that should send the market higher.
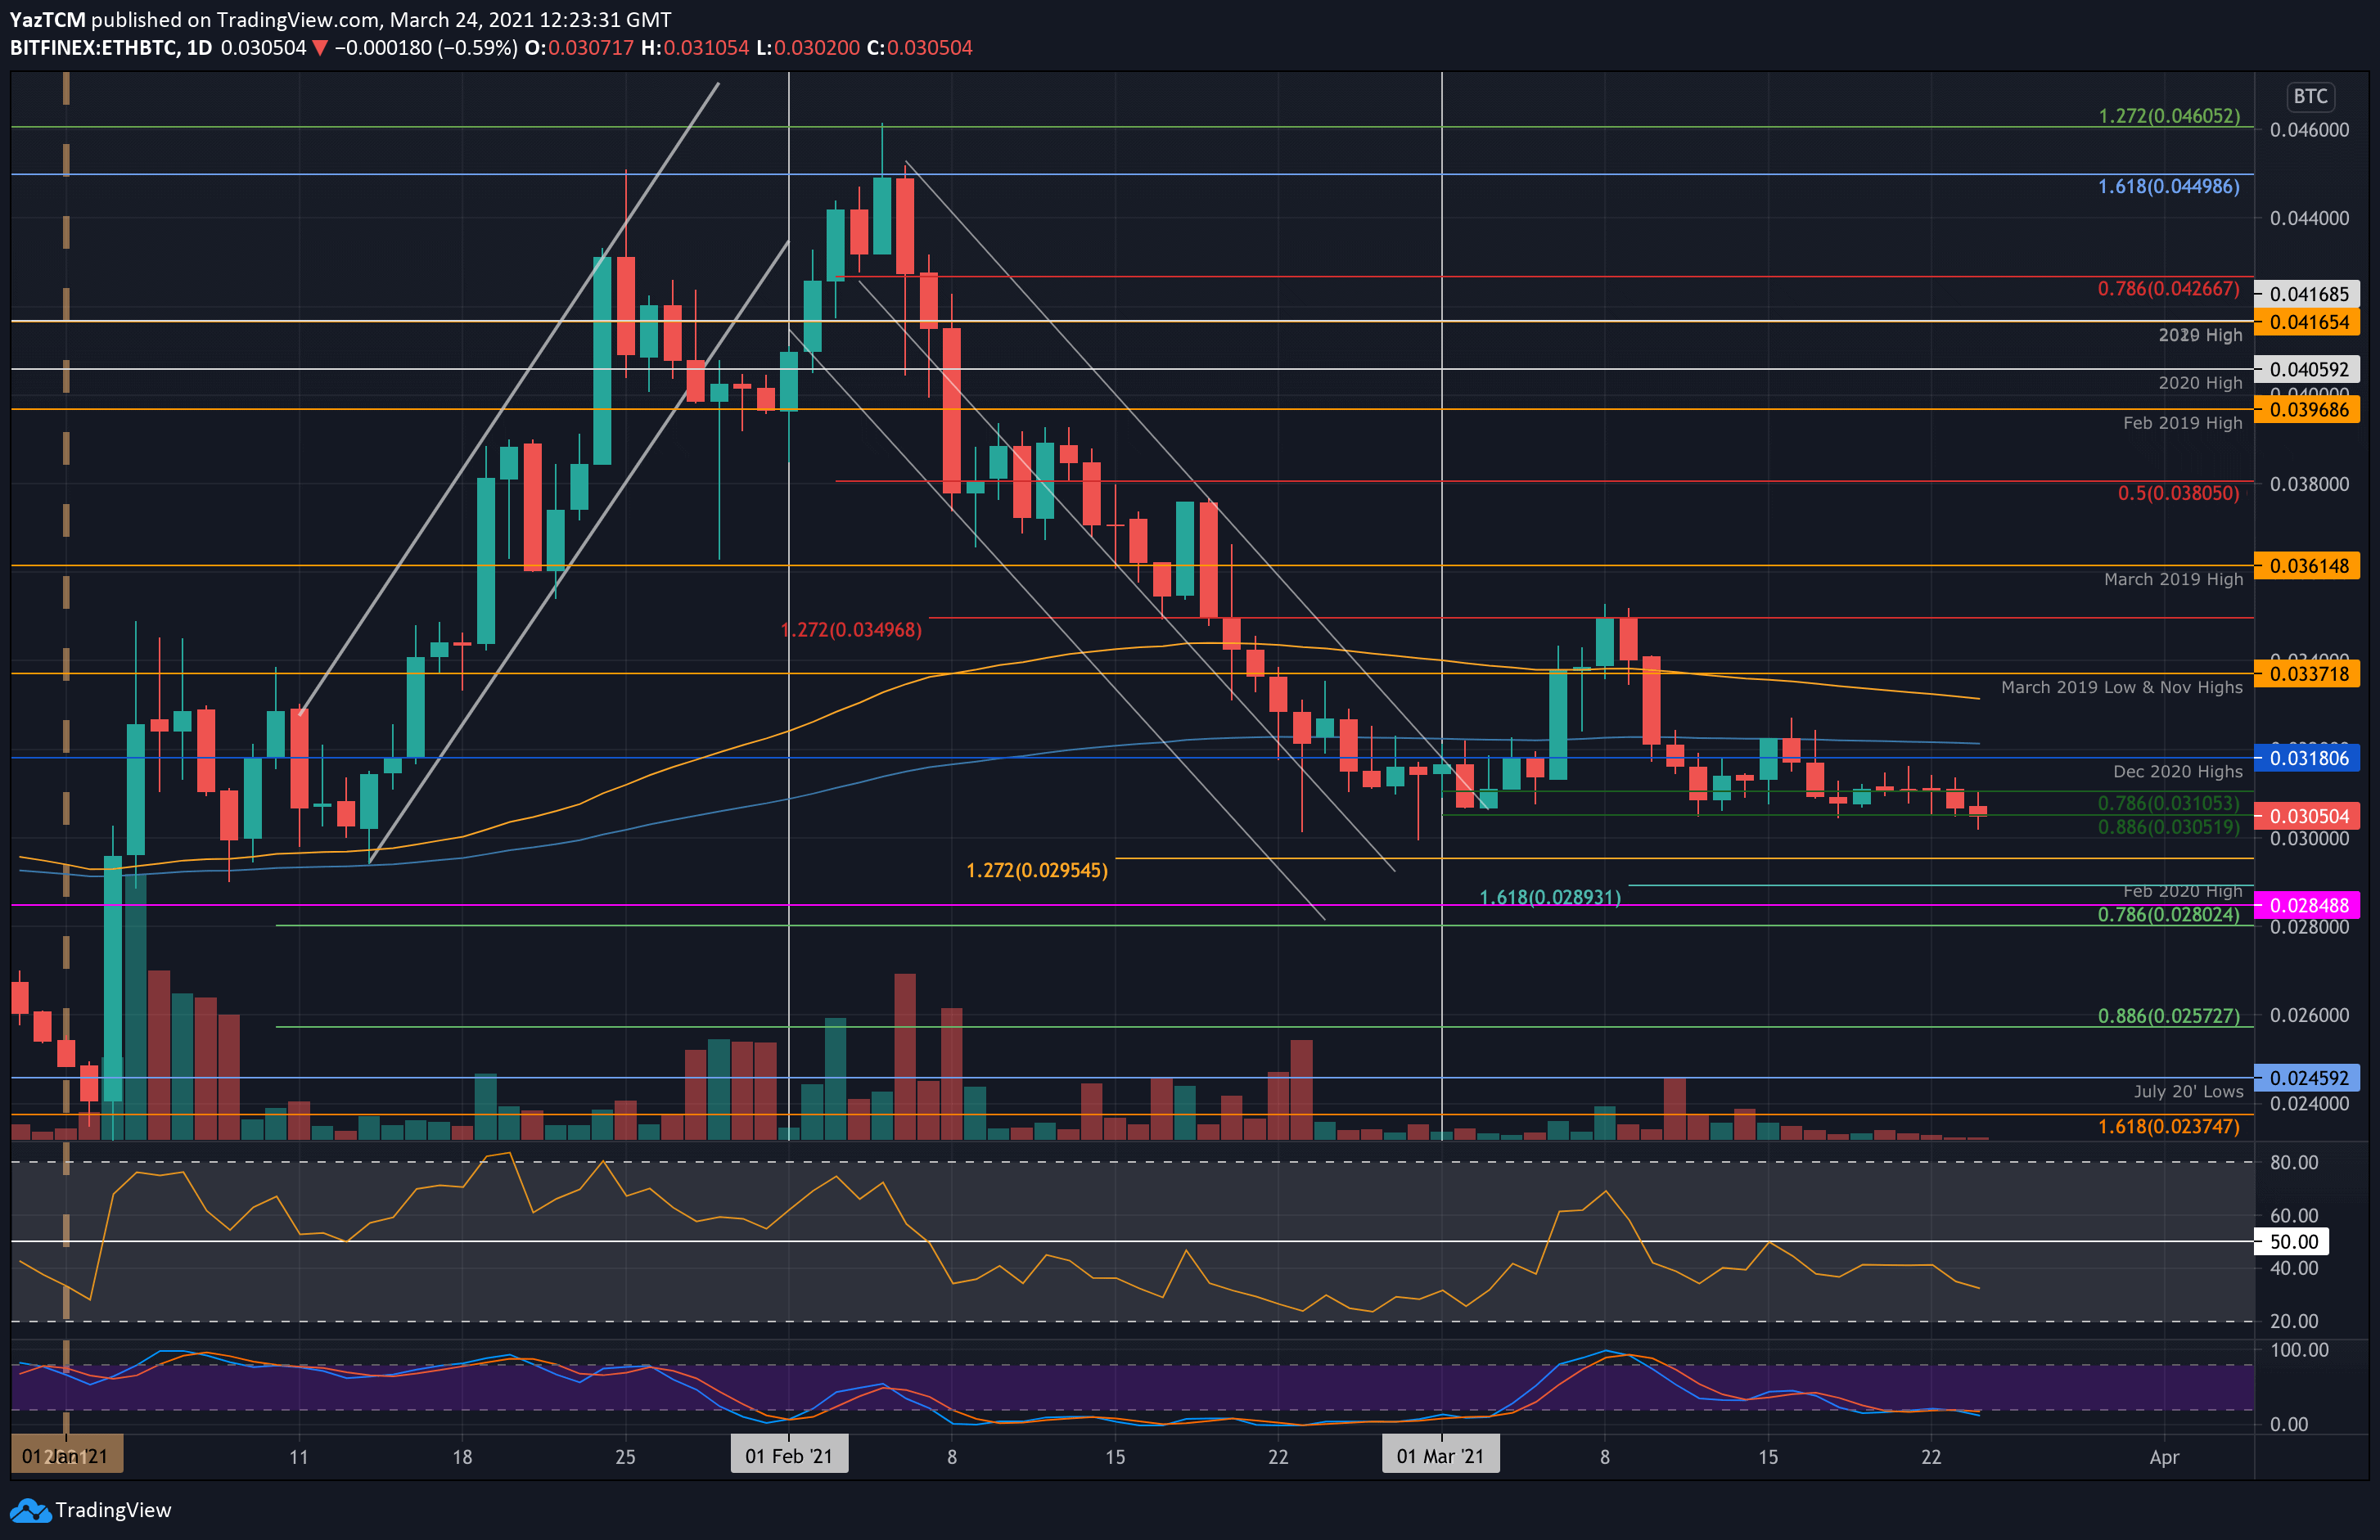
Key Support Levels: 0.0305 BTC, 0.03 BTC, 0.0295 BTC.
Key Resistance Levels: 0.031 BTC, 0.0318 BTC, 0.032 BTC.
Ethereum is showing some sign of weakness against Bitcoin. The cryptocurrency held support at 0.0305 BTC (.886 Fib Retracement) for the majority of the month. Today, the cryptocurrency spiked beneath this support, reaching as low as 0.0302 BTC.
It has since rebounded from there to climb back above 0.0305 BTC, but the spike lower is an indicator of weakness. A break beneath 0.03 BTC would be disastrous for ETH and is likely to push it lower toward 0.028 BTC.
It’s worth noting that we haven’t seen this price since last month on February 28th.
Looking ahead, the first level of support toward the downside lies at 0.0305 BTC. This is followed by 0.03 BTC, 0.0295 BTC, and 0.0285 BTC (Feb 2020 highs).
On the other side, the first resistance is located at 0.031 BTC. This is followed by 0.0318 BTC, 0.032 BTC (200-days EMA), and 0.0337 BTC (Nov 2020 Highs).
The RSI is in bearish territory and starts to head lower, indicating that the bearish momentum is starting to increase. If it continues to dip further, ETH will likely break the support at 0.03 BTC.