The inverse head and shoulders pattern in the Bitcoin chart is still active. However,
For this formation to play out, Bitcoin has to break above the formation’s neckline around the $4380 resistance level, which is the prior high. In case of a breakout, the target could be found at the mid $5000 area.
Those formations are not pure science, of course, as well as the targets, so take everything with extra caution.
The $5500 price level is the 0.618 Fibonacci retracement level of the massive decline from the $6300 area (since November 14). This target seems to me too bullish at the moment, and the bulls will have to show extra strength to extract this formation into reality.
The formation will be invalidated if the shoulder support level (~$3500) gets broken down followed by high volume.
Back to Ethereum ETH
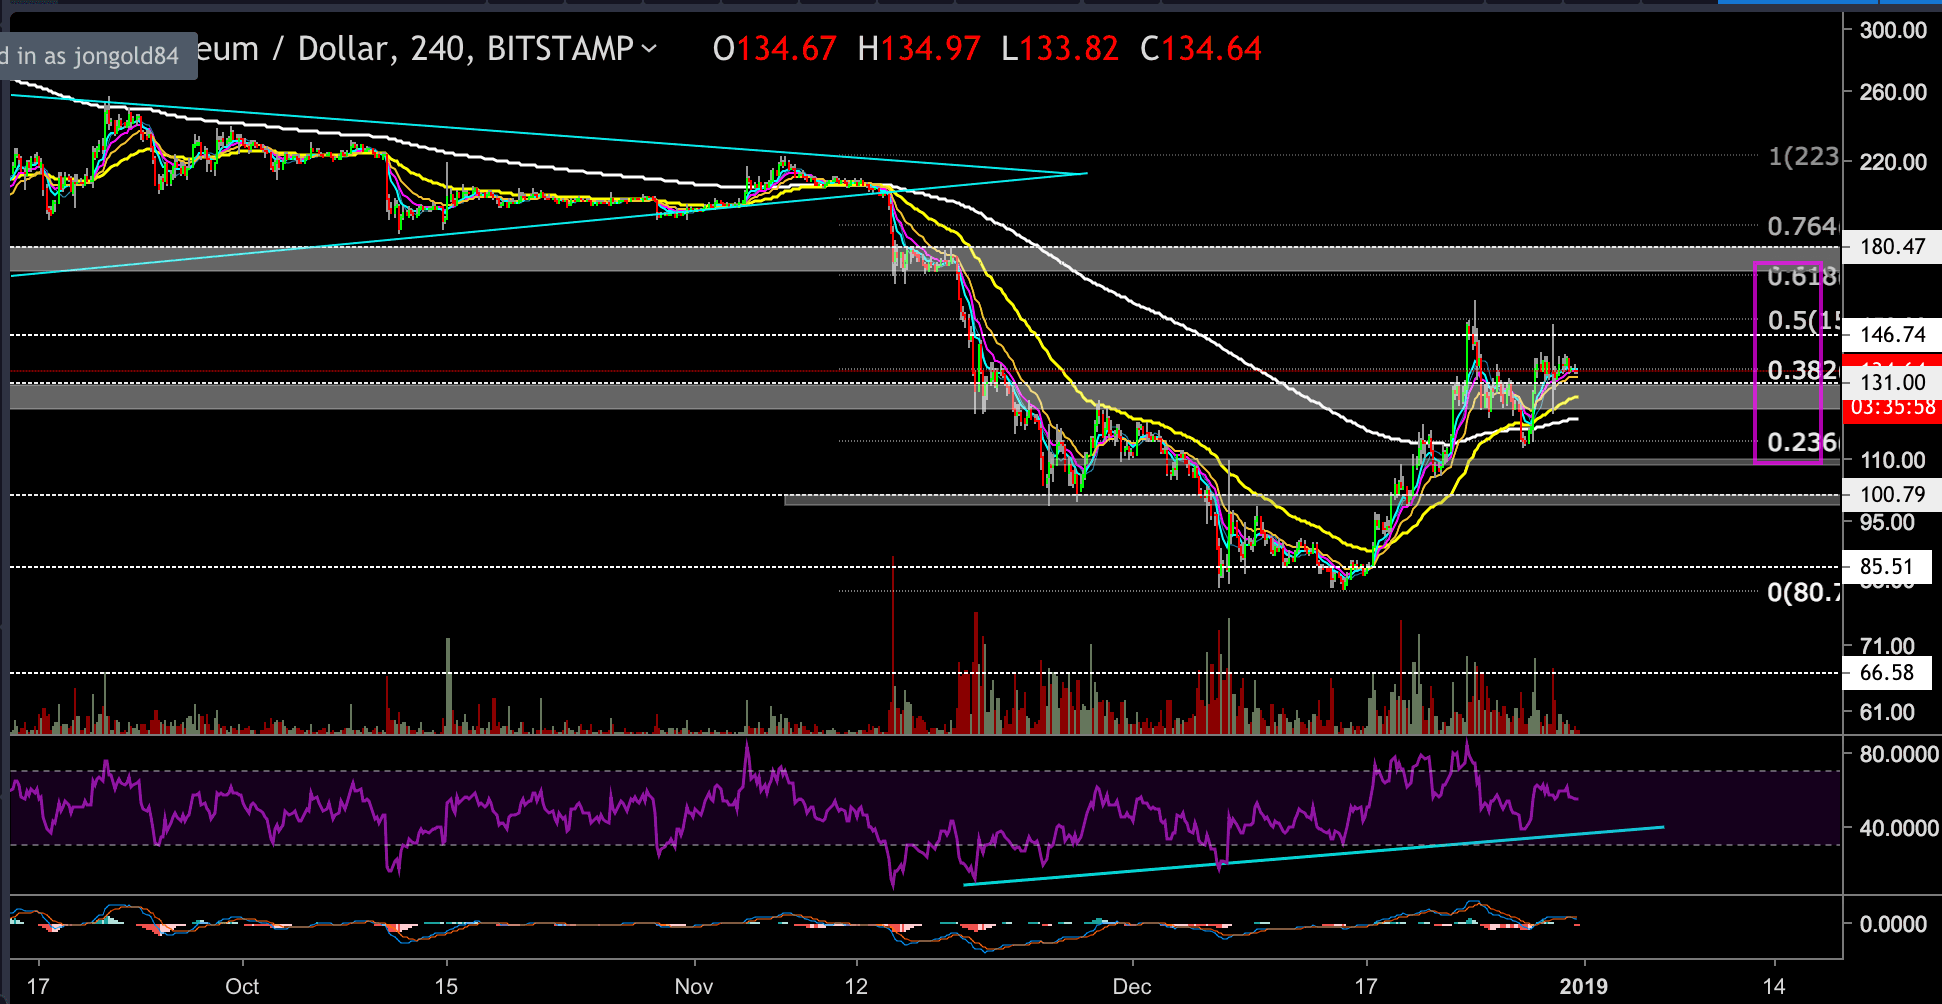
ETH is currently trading at the $135 price level, just above the $131-$124 support level.
Notice the vast Doji Japanese candle with the two long wicks, to both sides, precisely on the 0.382 Fibonacci retracement level.
This candle is a result of a “fight” between the bulls and the bears, each side is trying to win, but the forces are in equilibrium.
Looking at the ETH 4-hour chart
- We mentioned the golden crossover in our previous analysis. The 55-EMA (marked in a yellow line) had crossed over the 200 EMA (white line) which is a very bullish sign. But we would like to see this golden cross holds and that the EMA’s are climbing up the white line and not collapsing back on it.
- The next potential bullish target hasn’t changed since our last post: The First target could be found at the prior high of $145 – $150, while the higher target could be found at the $170 – $180 resistance level range.
- On the other hand, if ETH fails to hold on top the support level of $124 – $131 then it might test the 200 EMA around $120 or lower than that, around support level of $110.
- As long as ETH holds the support level and BTC hasn’t broken the inverse head and shoulders formation, the overall picture is bullish for short to mid-term.
ETH/USD BitStamp 4-Hour Chart
BTC/USD BitFinex 4-Hour Chart
SPECIAL OFFER (Sponsored)
LIMITED OFFER 2024 for CryptoPotato readers at Bybit: Use this link to register and open a $500 BTC-USDT position on Bybit Exchange for free!
Disclaimer: Information found on CryptoPotato is those of writers quoted. It does not represent the opinions of CryptoPotato on whether to buy, sell, or hold any investments. You are advised to conduct your own research before making any investment decisions. Use provided information at your own risk. See Disclaimer for more information.
Cryptocurrency charts by TradingView.