Let’s start with a quick look over Bitcoin: BTC is currently trading around the $3750 price level, which is precisely 50% decline from the last peak of $4400. It is a reasonable entry point for bulls looking for a long position, in case they believe that BTC is about to make a second run upward.
If BTC gets the demand needed for a bounce, then it will strengthen the probability of a possible inverse Head and Shoulders formation that is currently developing on the 4-hour chart. The mentioned possible bounce from this current support level could play out as the right shoulder of the pattern. BTC can decline even lower, and still, hold the option for this bullish formation. In case of a breakout, the technical target of this formation would be around $5500 – $5700.
ETH completes a nice run during the past week
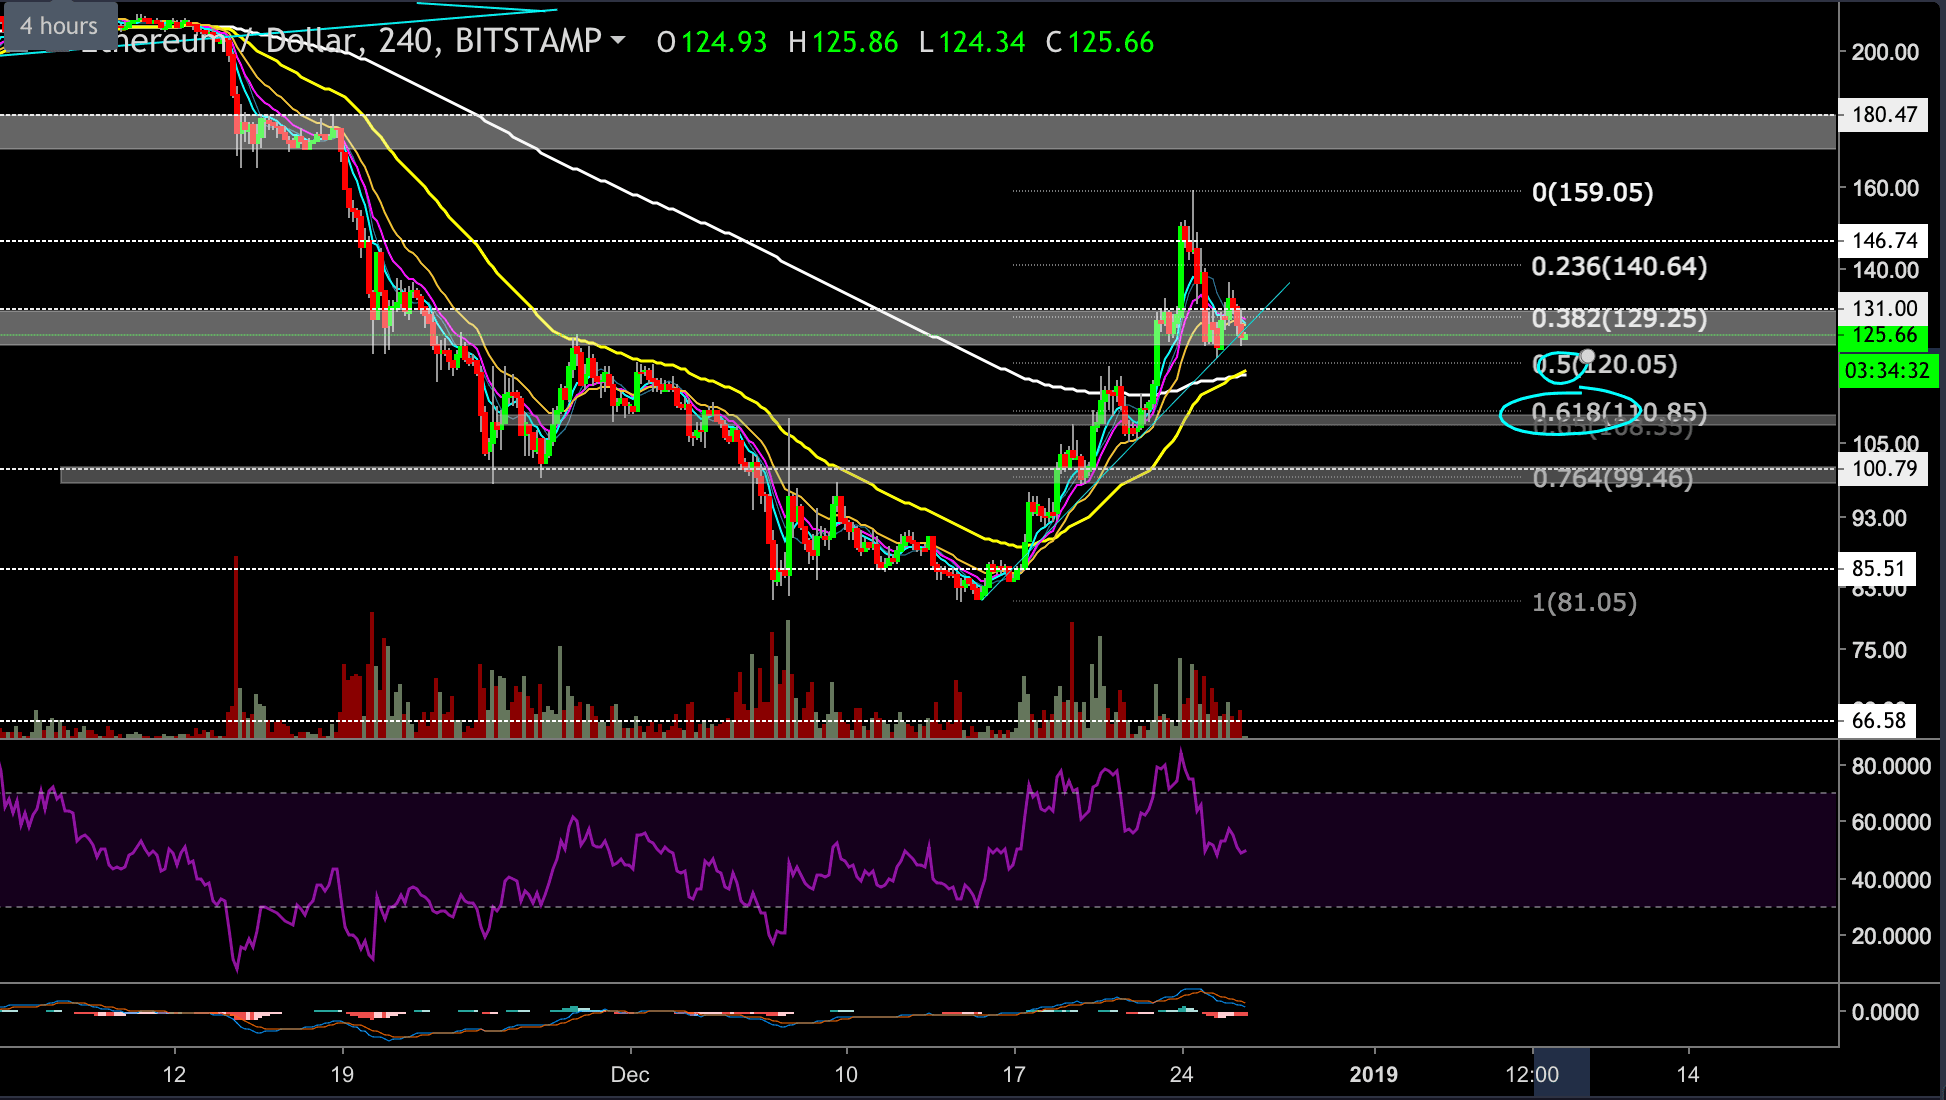
The highest candle closed exactly on our previous analysis target zone around the $145 price level, though the candle’s wick spiked to $158 for a short while. Over the past days, ETH had the highest gain among the major altcoins.
There is news regarding an upgrade in the Ethereum system, the miner’s block reward might be reduced, and it could positively affect the ETH value and support the strong move we noticed in the ETH chart.
Since the peak, ETH corrected almost 50% (from the last bullish move), as BTC did, and is currently trading above the $123 support level.
Looking at the ETH-USD chart
- If the $123 support level holds and ETH does bounce back upward, then the next target could be found at the $145 or $158 price levels (support-turned resistance), and if it breaches these levels, then we will probably see ETH rallying up to $170 – $180.
- Notice also the golden crossover on the 4-hour chart (55 EMA had crossed above the 200 EMA). This is usually a very bullish signal, but I would like to see the 55 EMA continues higher and holds above the 200 EMA for a more extended period.
- On the other hand, if ETH breaks below the $123 support level, then the EMA lines might be the first bearish target around the $118 price level, and a lower target could be found at the $110 support level, which is the 0.618 Fibonacci retracement level of the last high.
- The 0.618 Fib retracement level is another fascinating point of entry for the bulls looking to collect some cheap Ether.
- Notice also the lower trend-line that was held nicely during the past ten days: If the 4-hour candle closes below that trendline, then ETH will probably continue decline toward the mentioned bearish targets.
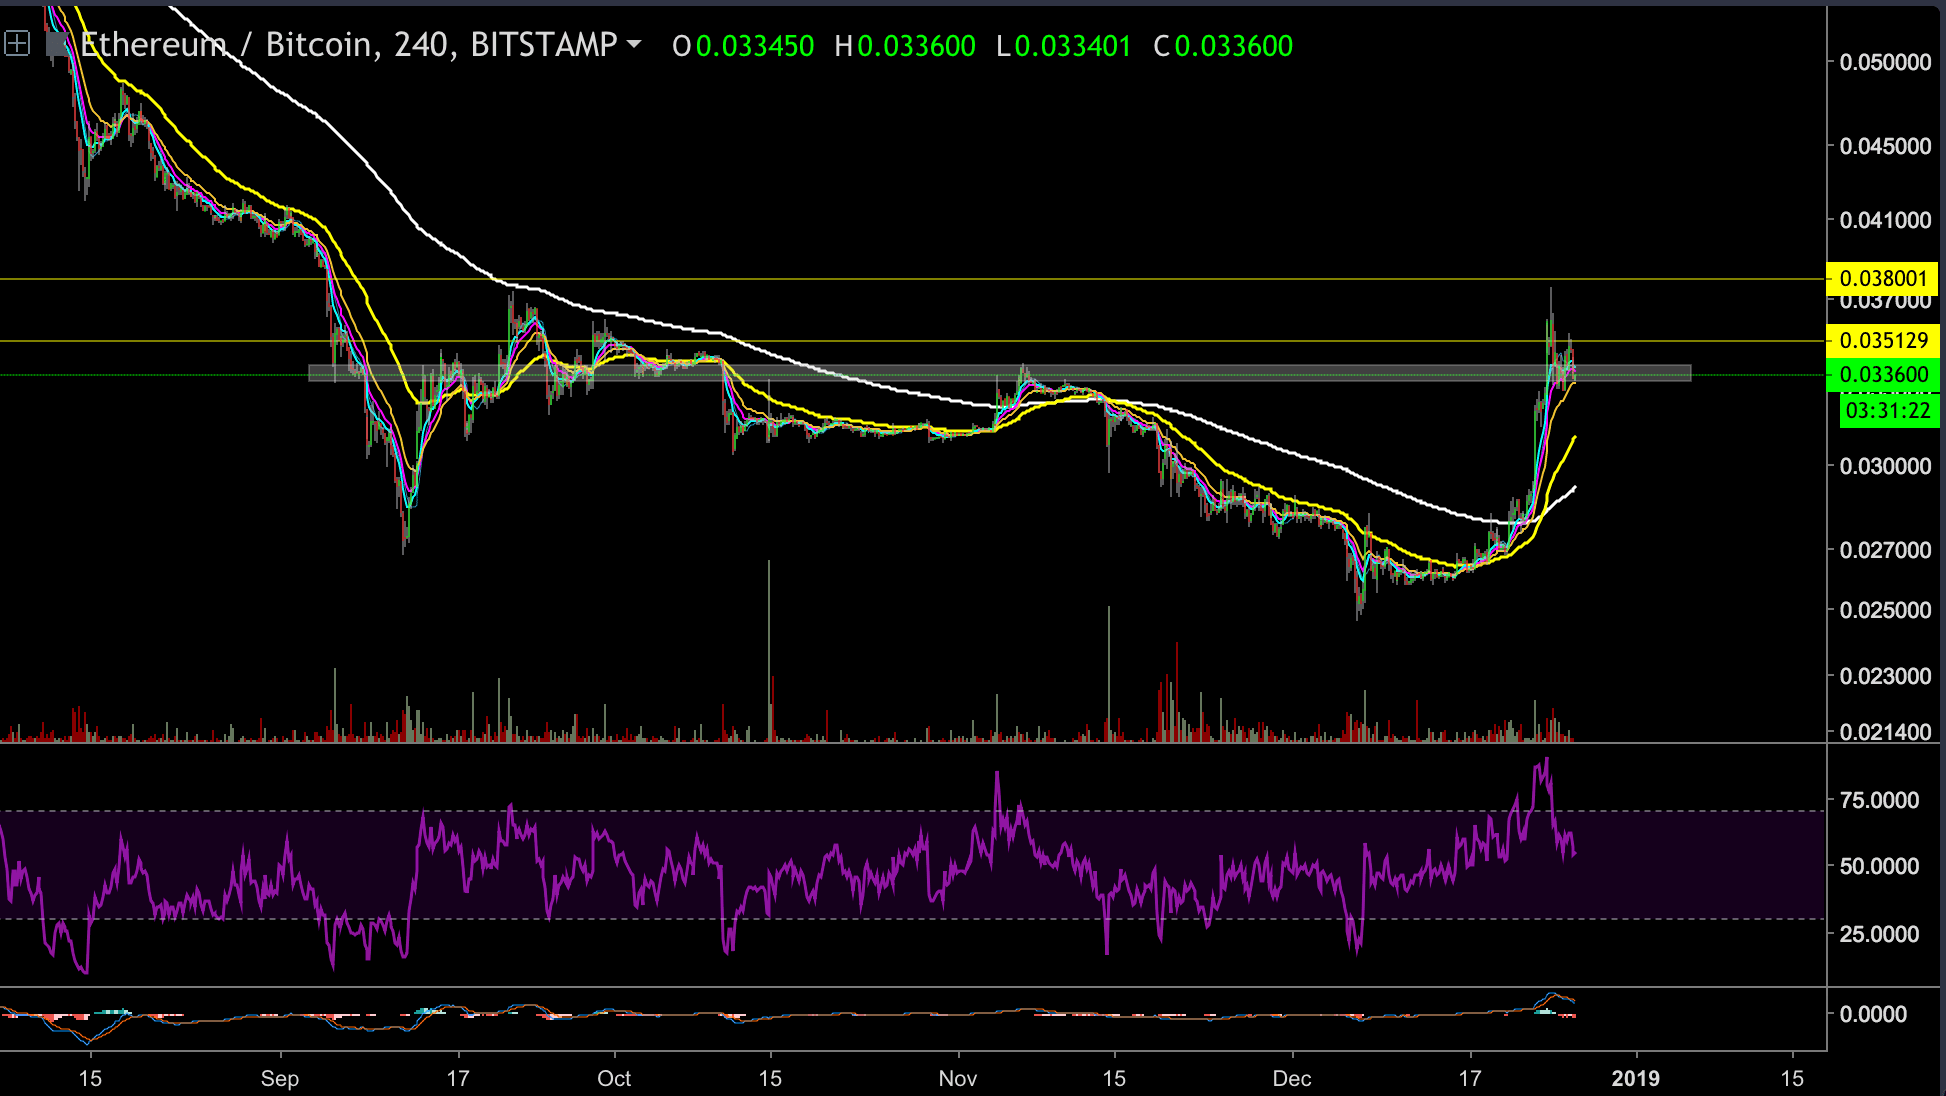
Looking at the ETH-BTC chart
ETH is currently trading around the 0.0333 – 0.034 BTC support level, after getting rejected by the 0.38 daily chart’s resistance level.
ETH/USD BitStamp 4-Hour Chart
ETH/BTC BitStamp 4-Hour Chart
SPECIAL OFFER (Sponsored)
LIMITED OFFER 2024 for CryptoPotato readers at Bybit: Use this link to register and open a $500 BTC-USDT position on Bybit Exchange for free!
Disclaimer: Information found on CryptoPotato is those of writers quoted. It does not represent the opinions of CryptoPotato on whether to buy, sell, or hold any investments. You are advised to conduct your own research before making any investment decisions. Use provided information at your own risk. See Disclaimer for more information.
Cryptocurrency charts by TradingView.