When everybody thinks that a specific scenario is going to take, what is likely to happen? Correct, precisely the opposite.
While everybody in the crypto markets was waiting for Bitcoin to break down the $3000, it turned out to be the perfect point for a short squeeze and a counter move or maybe a “dead cat bounce”?
At the time of press, BTC price is up 27% since the last low of $3120 and is trading above the $4000 price. BTC might try to test the $4200-4350 resistance level or even higher, around $4400 – $4500.
If we utilize the Fibonacci retracement tool from the top of the move down at the $6000 area, to the lowest point around the $3000, we see that the last three days’ rally is targeting the 0.382 Fib retracement level (~$4500), which is the typical target for “dead cat bounce” move.
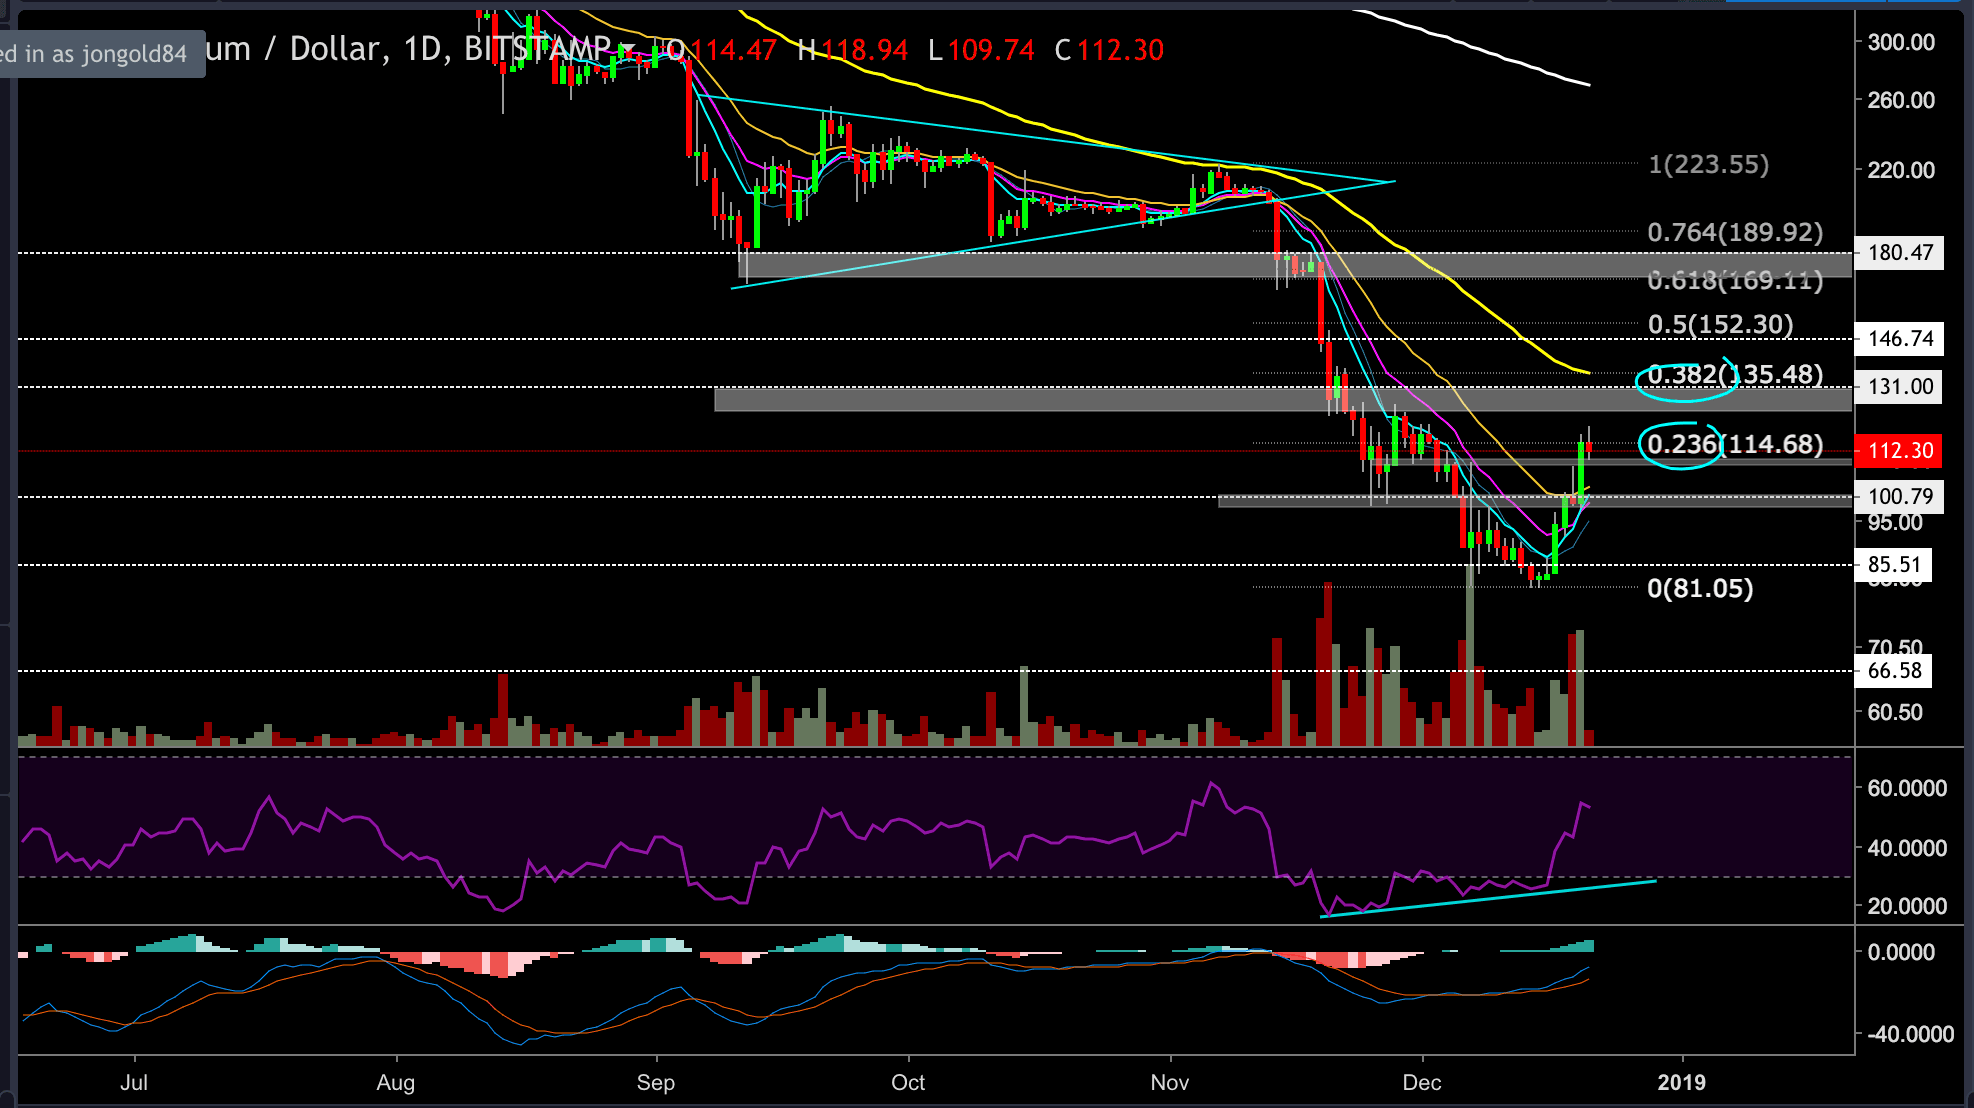
Ethereum had gained as well: ETH price rose 40% over the last three days and is currently trading at the $112 price level. As expected, the major altcoins are raising a bit more than Bitcoin.
In our previous ETH analysis, we anticipated that if the bulls manage to take back control and ETH price breaches above the upper trend line and hold, then it will probably lead a retest of the $100 resistance level. Well, this is exactly how things had turned out.
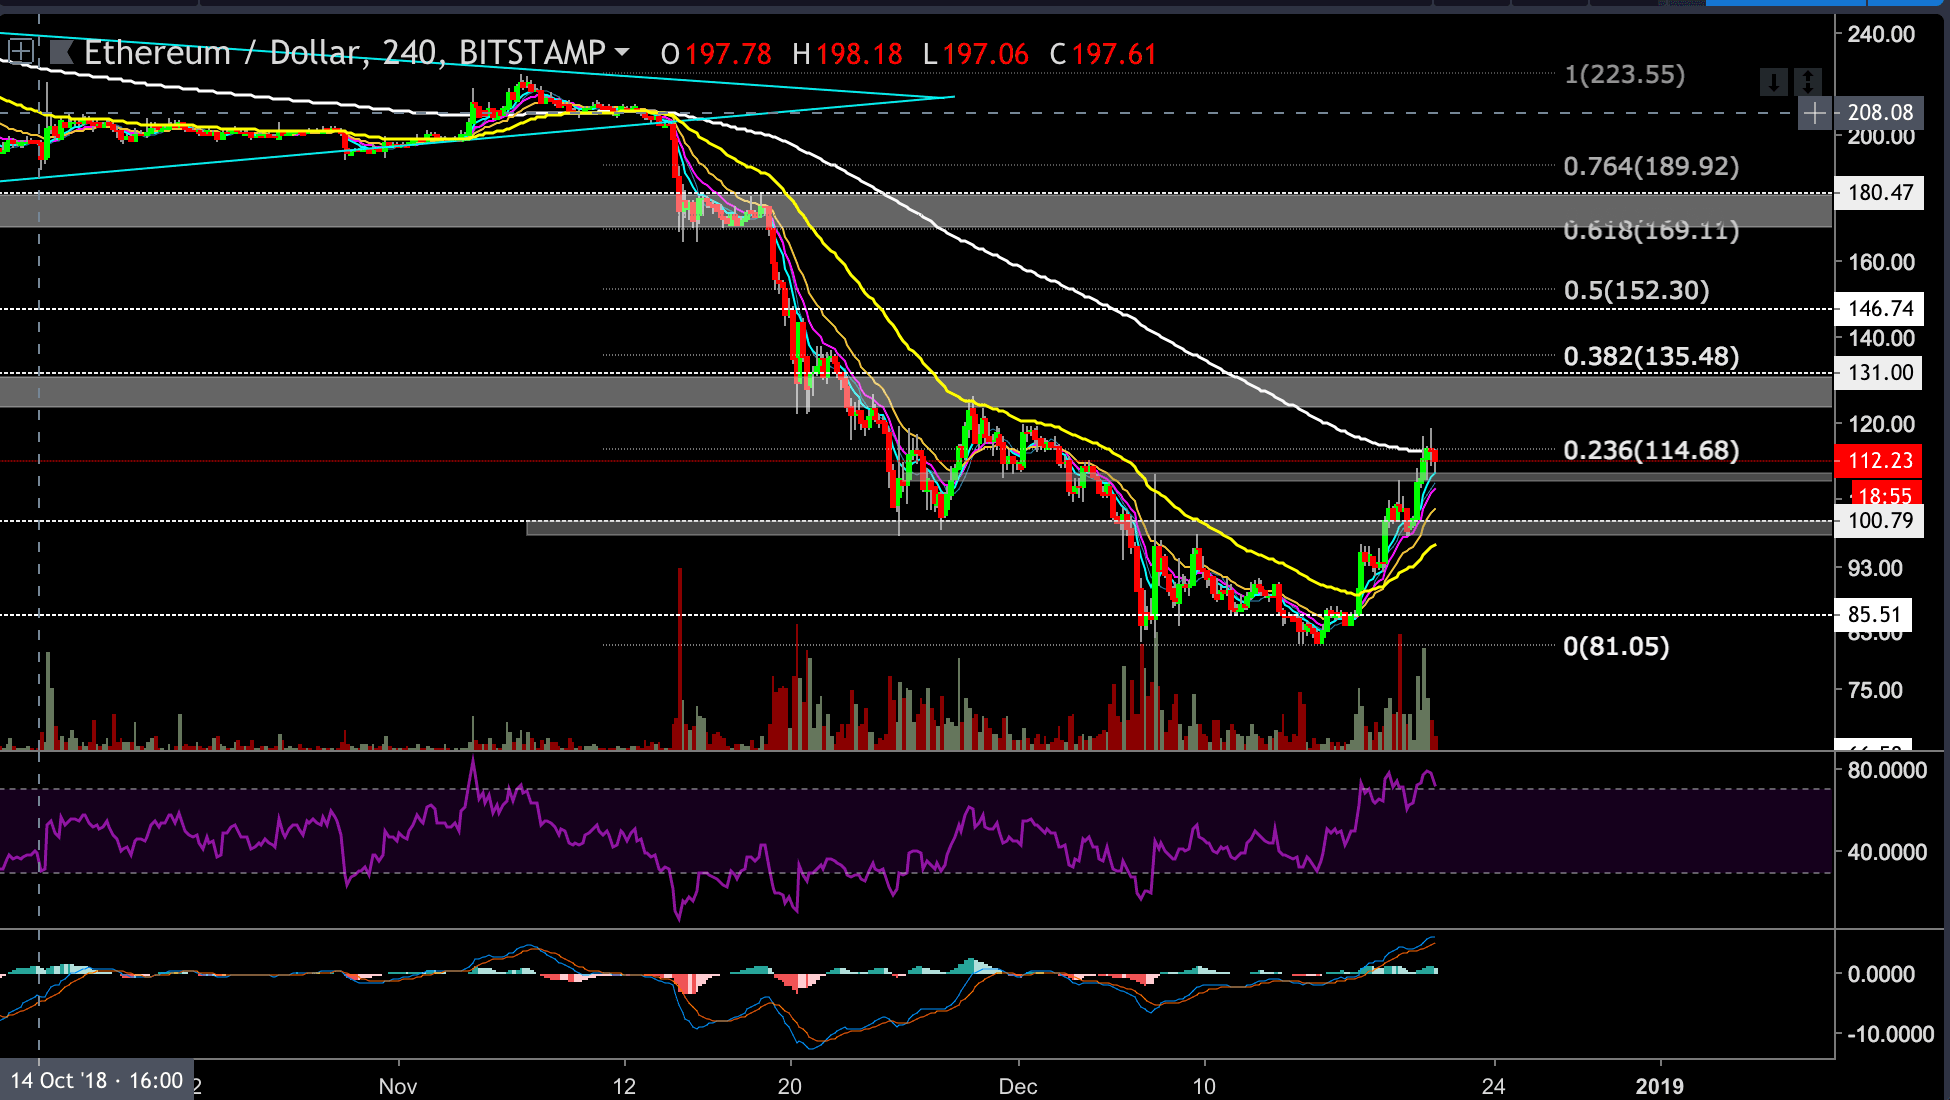
Looking at the 4-hour chart:
- ETH is currently fighting to breach above the 200 EMA (marked by a white line). If the coin breaks above, then the next target could be located at the next resistance level of $124 – $130 range or even $135.
- The 0.382 fib retracement level (of the long decline) is currently located at the $135, as well as the daily 55EMA, so ETH might try to spike towards this level before turning bearish again. This might be followed by a “shooting star” type of candle, which signals an ending for the current movement.
- Breaking above these levels won’t be easy; if ETH attempts to go higher, it will probably have to run through some consolidation before breaking up (to regain momentum).
- We always have to remember that markets don’t move in a single straight line and that price moves in waves. So after such a rally, there must be a sideways move or some sort of
- ETH chart has a significant support level around $100, along with a weaker support area at the $108 price level, close to where the coin is trading right now.
- The 4-hours RSI indicator is located at the overbought regions but doesn’t show any negative diversions yet, which is a good sign for the bulls.
- The MACD indicator is moving nicely in the upper half of the channel, and the histogram is still ticking higher.
ETH/USD BitStamp 4-Hour Chart
ETH/USD BitStamp 1-Day Chart
Cryptocurrency charts by TradingView. Technical analysis tools by Coinigy.
SPECIAL OFFER (Sponsored)
LIMITED OFFER 2024 for CryptoPotato readers at Bybit: Use this link to register and open a $500 BTC-USDT position on Bybit Exchange for free!
Disclaimer: Information found on CryptoPotato is those of writers quoted. It does not represent the opinions of CryptoPotato on whether to buy, sell, or hold any investments. You are advised to conduct your own research before making any investment decisions. Use provided information at your own risk. See Disclaimer for more information.