Since our previous analysis, the crypto market hasn’t done much and is still trading sideways. The Bitcoin chart is currently attempting to break above the descending trend-line resistance level that has been keeping the price below it for the past 14 days.
If BTC price breaks up the trend-line and the price holds above with an enormous amount of volume, it could be a positive sign for the bulls, at least for the short-term.
On the other hand, if BTC fails by the resistance level (looking for signs of shooting star candle or large red volume candle), it could be a sign that the bears are still in control and we could expect a continuation of the downward.
It is not clear at the moment where the market is heading to (in the short-term), and this attempt to break the resistance level will most likely point the next days’ direction.
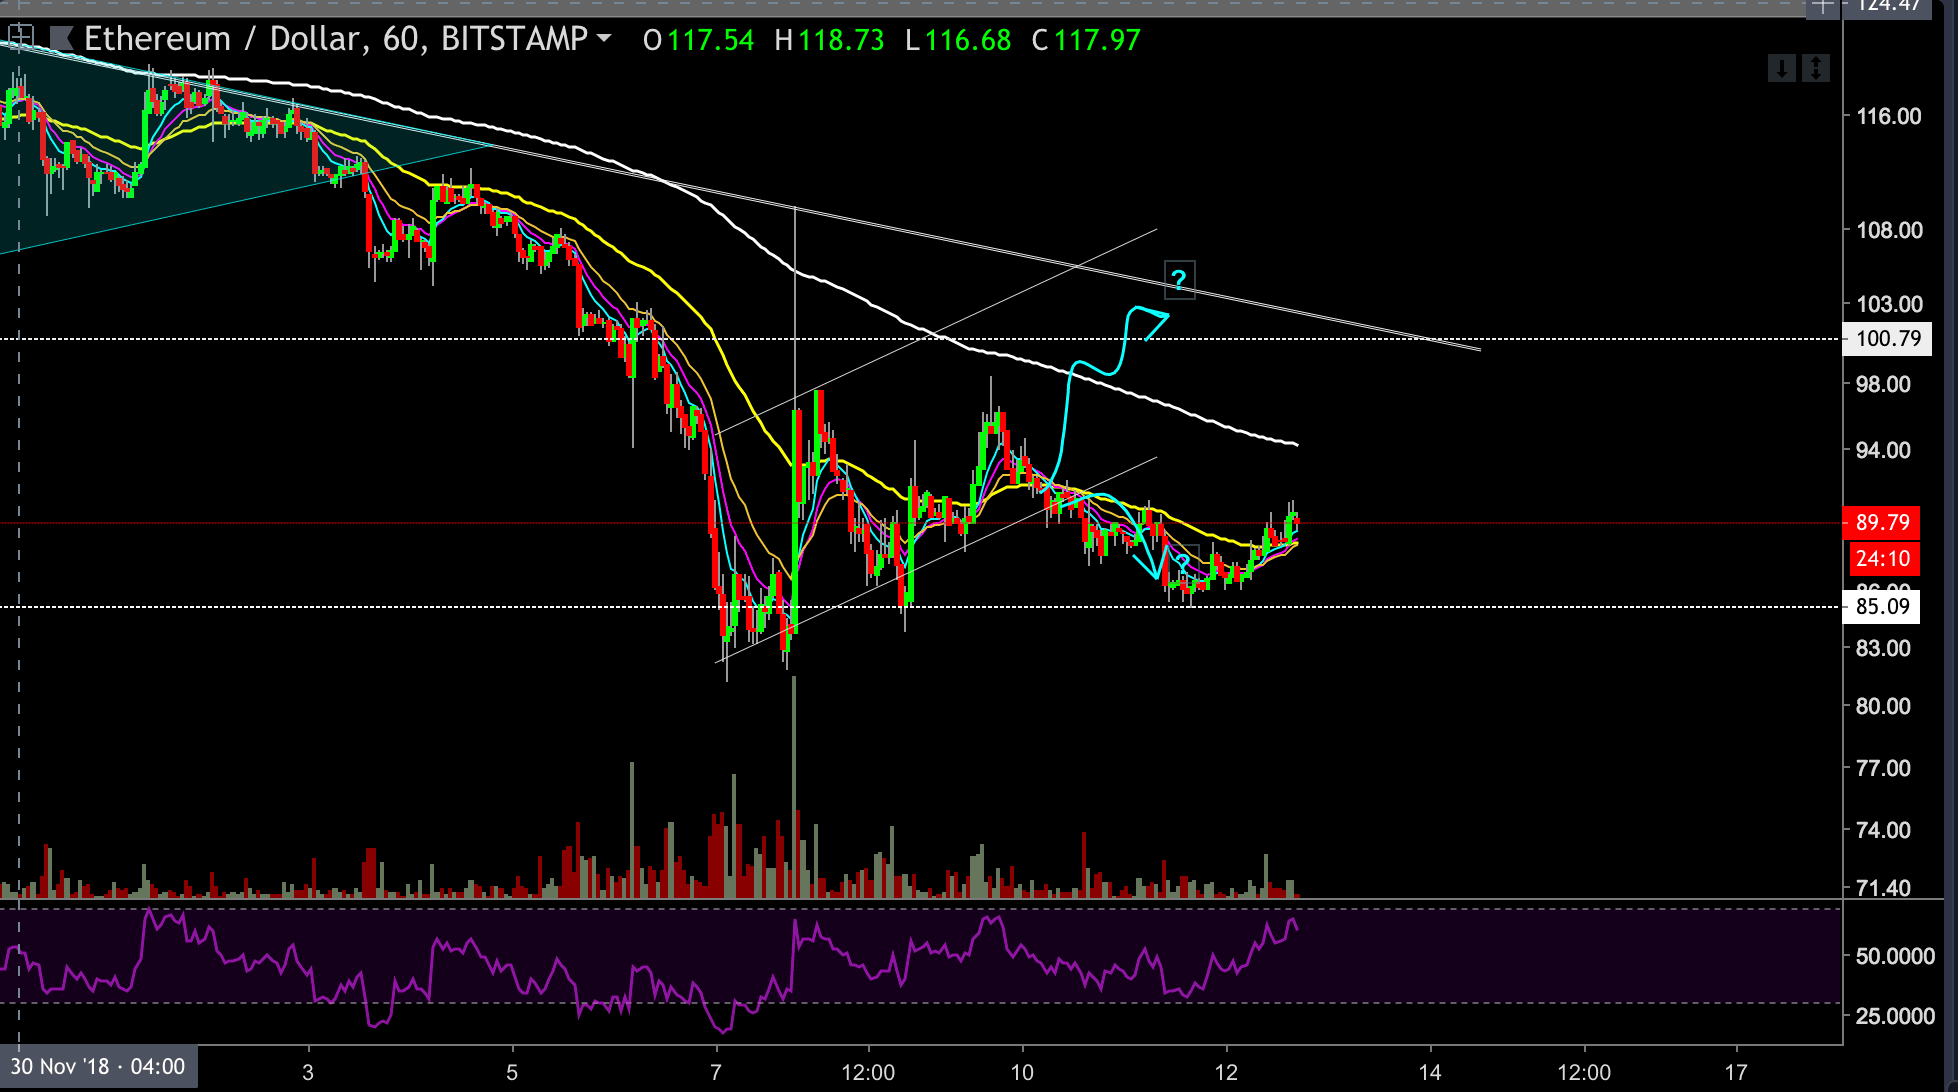
In our last analysis, we presented two continuation estimations on the ETH hourly chart. We can see that ETH chose the bear estimation, and broke below the trend-line support level. Since then ETH has been moving sideways.
Looking at the ETH chart
- ETH is currently trading at the $90 price mark, on top the 21 EMA.
- In case that Bitcoin breaches the above resistance level and continues higher, then we would expect the coin to move accordingly, with a potential target of around $97- $100. At that area lays the next resistance level.
- If BTC fails to break up the descending trend-line, then ETH will most likely down towards its last lows around the $85 price level. Below is the $80 support, before discovering a new yearly low (the next support would be around $66).
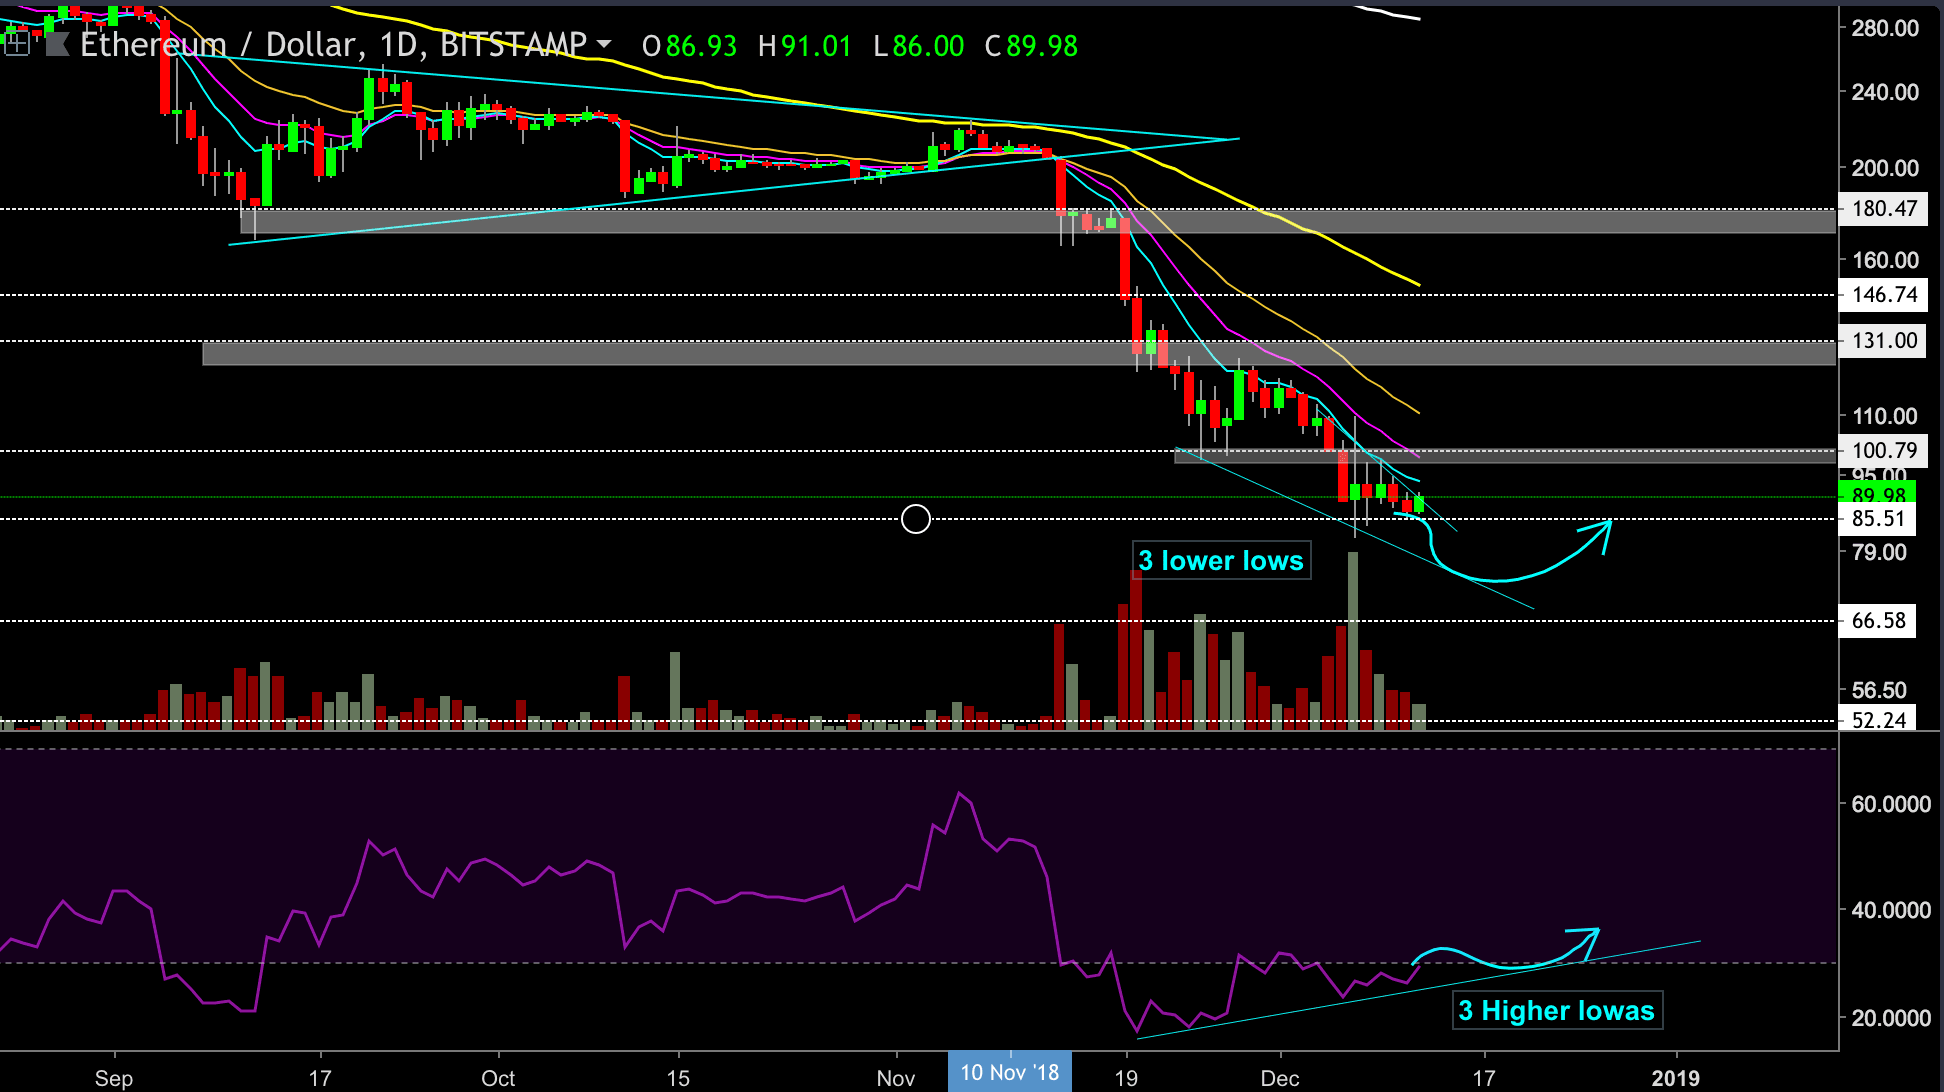
- Looking at the daily chart, we can notice the RSI indicator is still holding at the positive diversions. I would expect to see another leg down in price action, creating a lower low, while the RSI is building the third higher low, it might be a very positive signal ahead of an upcoming bullish move (as can be seen on the following chart).
ETH/USD BitStamp 1-Hour Chart
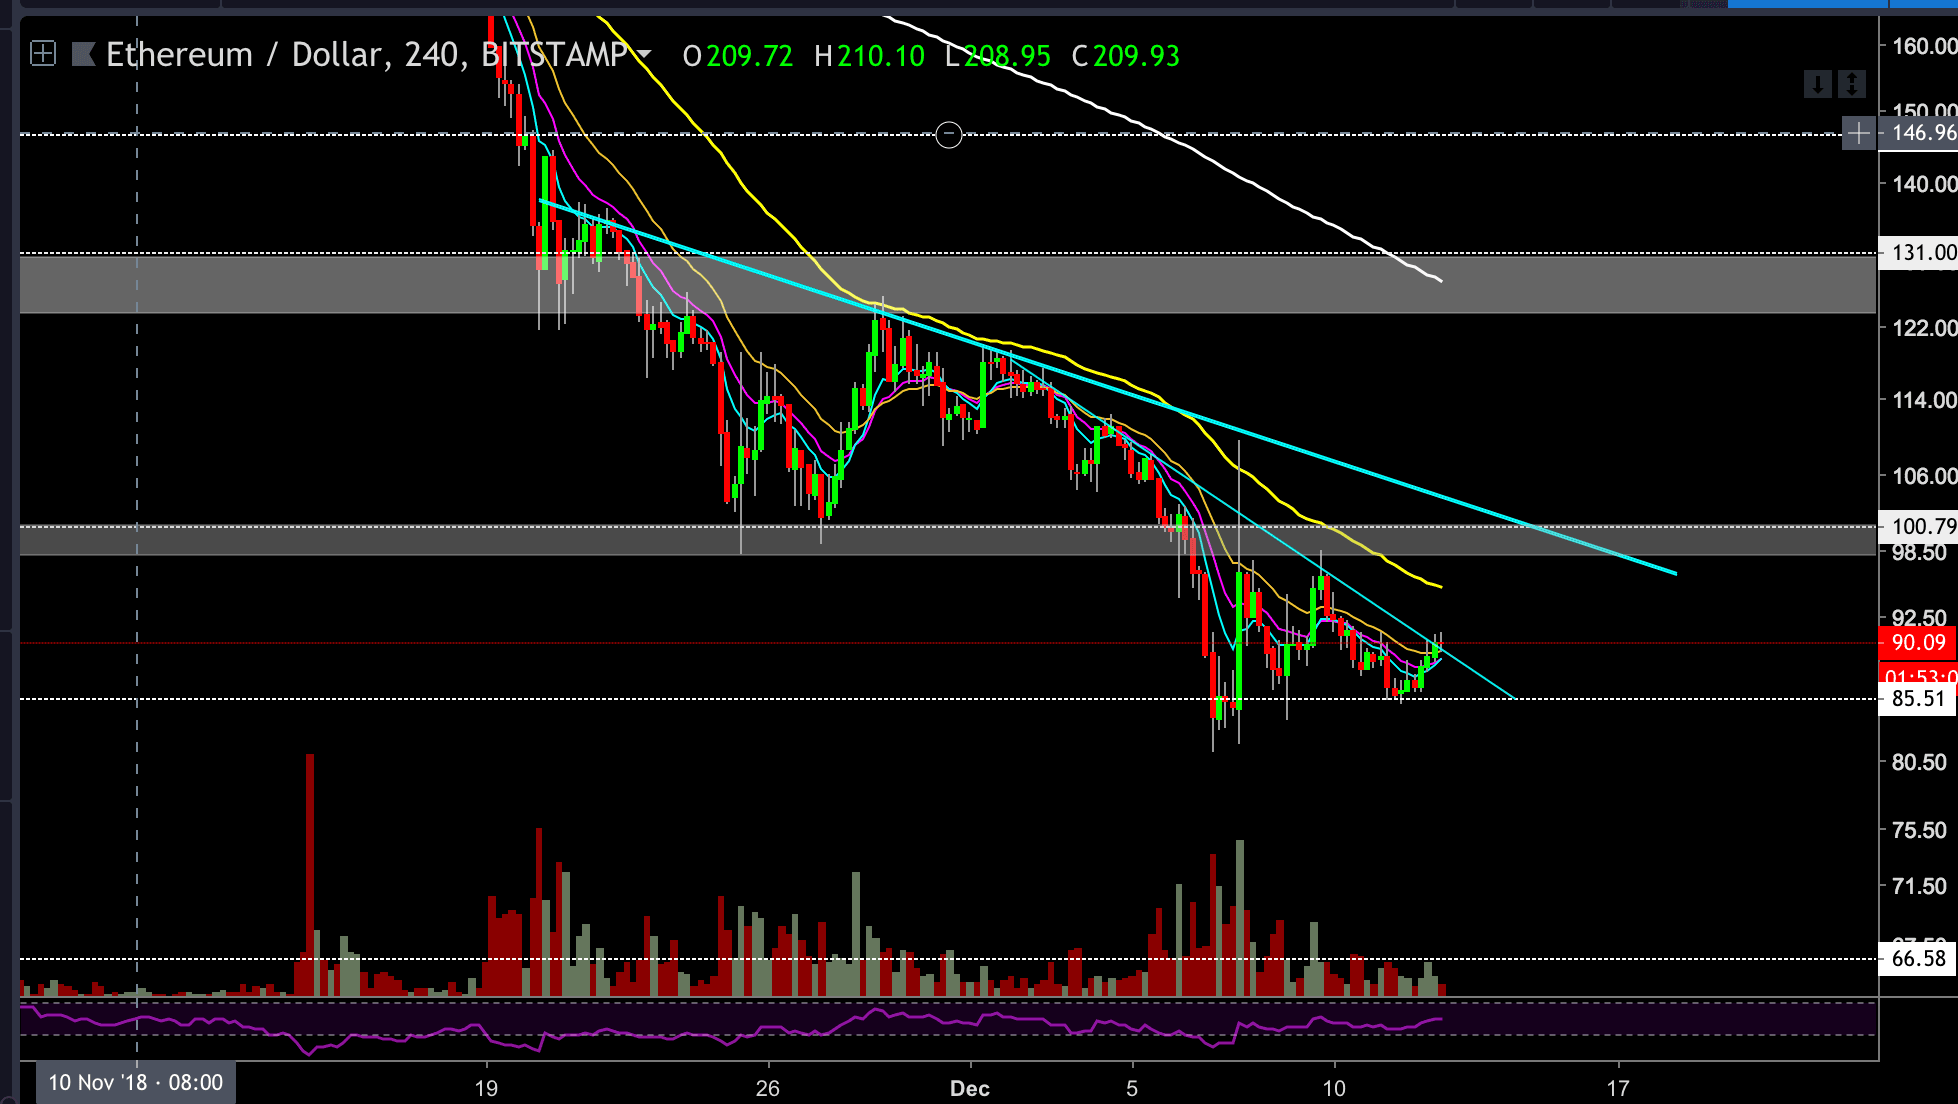
ETH/USD BitStamp 4-Hour Chart
ETH/USD BitStamp 1-Day Chart
Cryptocurrency charts by TradingView. Technical analysis tools by Coinigy.
SPECIAL OFFER (Sponsored)
LIMITED OFFER 2024 for CryptoPotato readers at Bybit: Use this link to register and open a $500 BTC-USDT position on Bybit Exchange for free!
Disclaimer: Information found on CryptoPotato is those of writers quoted. It does not represent the opinions of CryptoPotato on whether to buy, sell, or hold any investments. You are advised to conduct your own research before making any investment decisions. Use provided information at your own risk. See Disclaimer for more information.