The crypto market marked new annual lows during the past weekend. Bitcoin hit the $3200 price level, which is the lowest BTC price since October 2017, and Ethereum lost the $85 support to test an $80 price tag which was last seen during May 2017.
After hitting the above lows, we noticed a short squeeze maneuver taking place, With Bitcoin chart spiking 10%. This maneuver was very likely to take place, as we alerted in our last analysis about such possibility.
When the Bitcoin open short positions hit their all-time high level, it is typically a warning sign for a potential short squeeze attempt. And this is exactly what we saw yesterday for the second time: The Bitcoin shorts chart spiked up to 43,000 BTC (Bitfinex) before their squeeze back to the 37,000 BTC levels.
The spike in the price of Bitcoin started a mini-trend reversal, that is so-far holding, but this mini uptrend is looking more like a bear flag rather than a potential bottom.
The $3500-$3650 price level, which is currently acting as strong resistance, needs to be breached with high volume and to be tested once again as a support, in order to see a possible uptrend continuation.
Back to Ethereum
- ETH hit our previous analysis’ targets at the $84-$85.
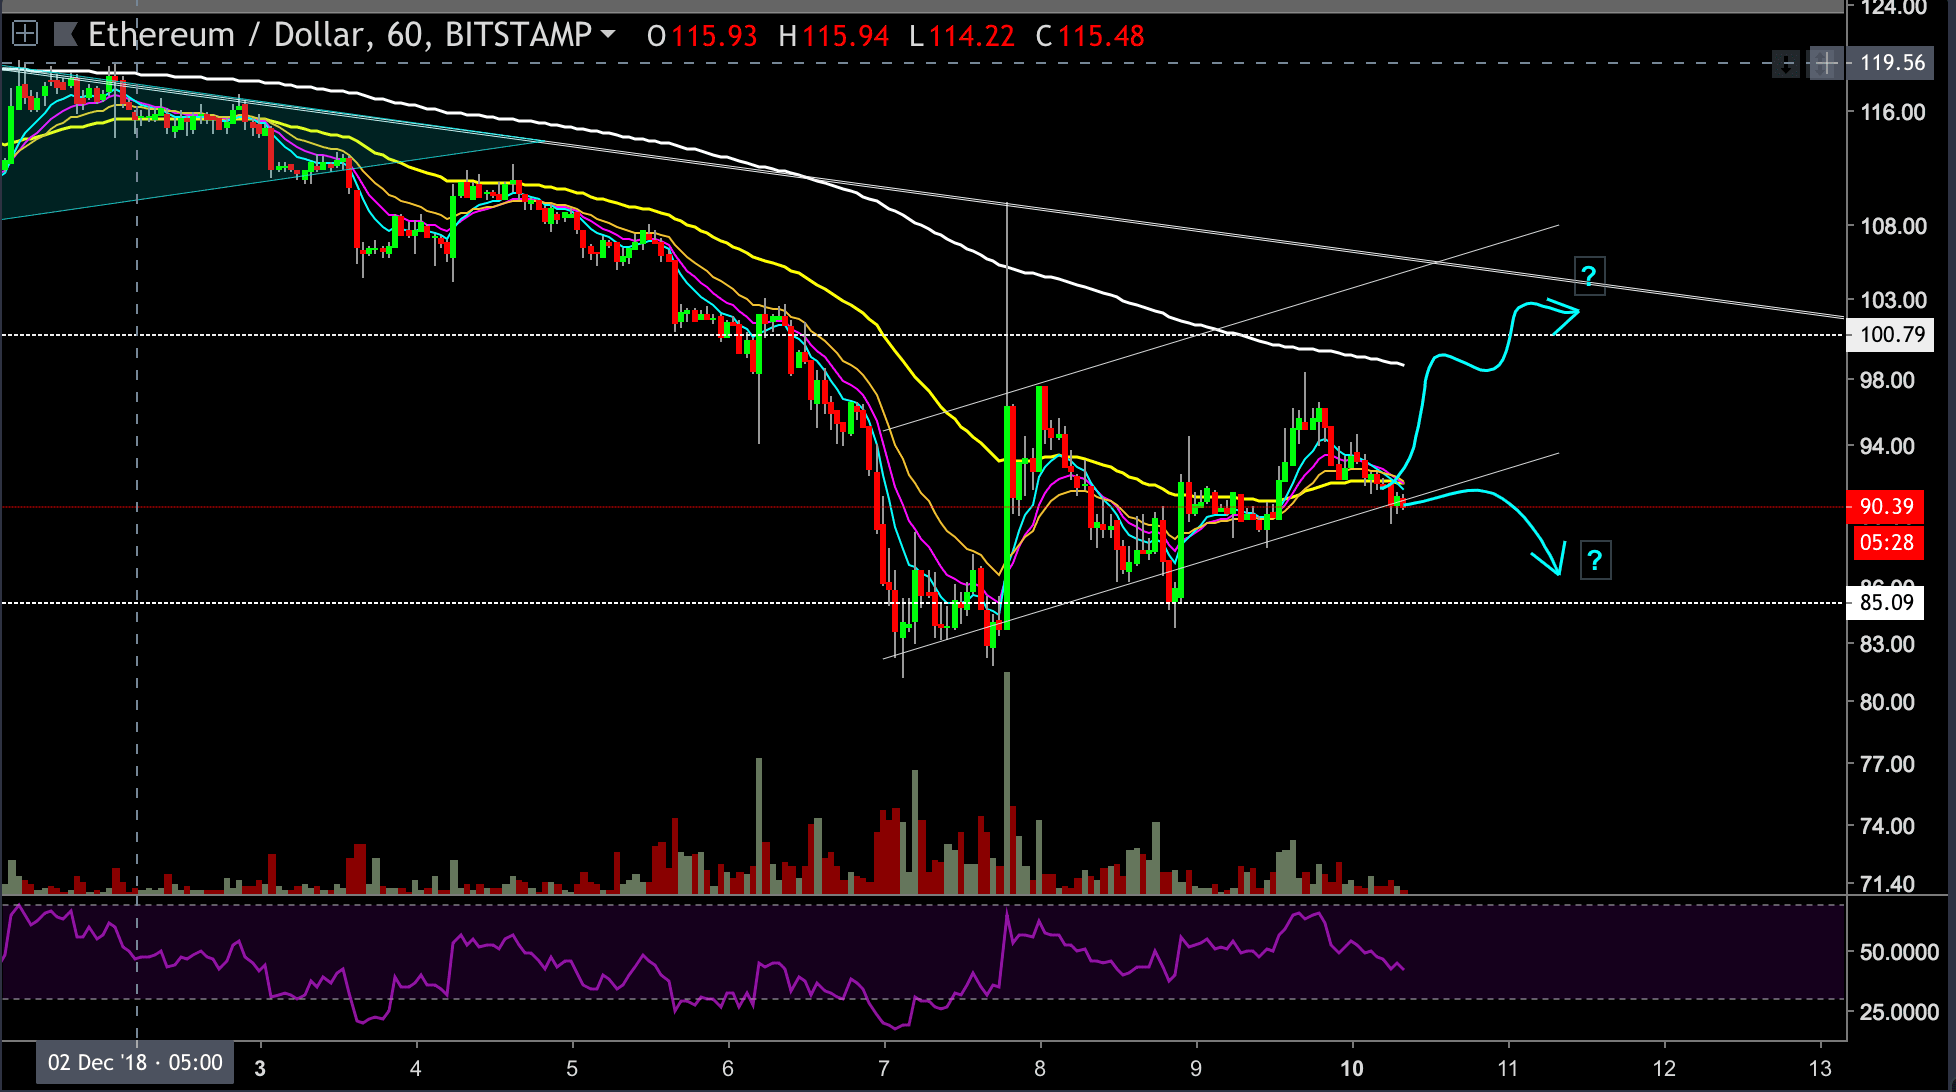
- Since then, the short squeeze had helped ETH to rally back to $110 for a little while. At the moment, the ETH chart is consolidating sideways around the $90 price levels.
- If the bulls manage to continue the uptrend and price breaks above the upper channel’s trend-line at $110, then ETH could try for the next resistance level at the $122-$126 price area. However, it wouldn’t be easy. ETH will have to gain extra strength to successfully overcome the resistance along the way, including the $100 mental resistance level.
- On the other hand, if the ETH price breaches below the channel’s lower trend-line, then ETH will likely try the $80s regions one more time. If the above breaks down, then $69 and $50 are the next potential targets for the coin.
- At the moment on the 1-hour chart, ETH is struggling to stay above the channel’s support level around the $90’s price range. The outcomes of this will determine the next short-term direction for ETH.
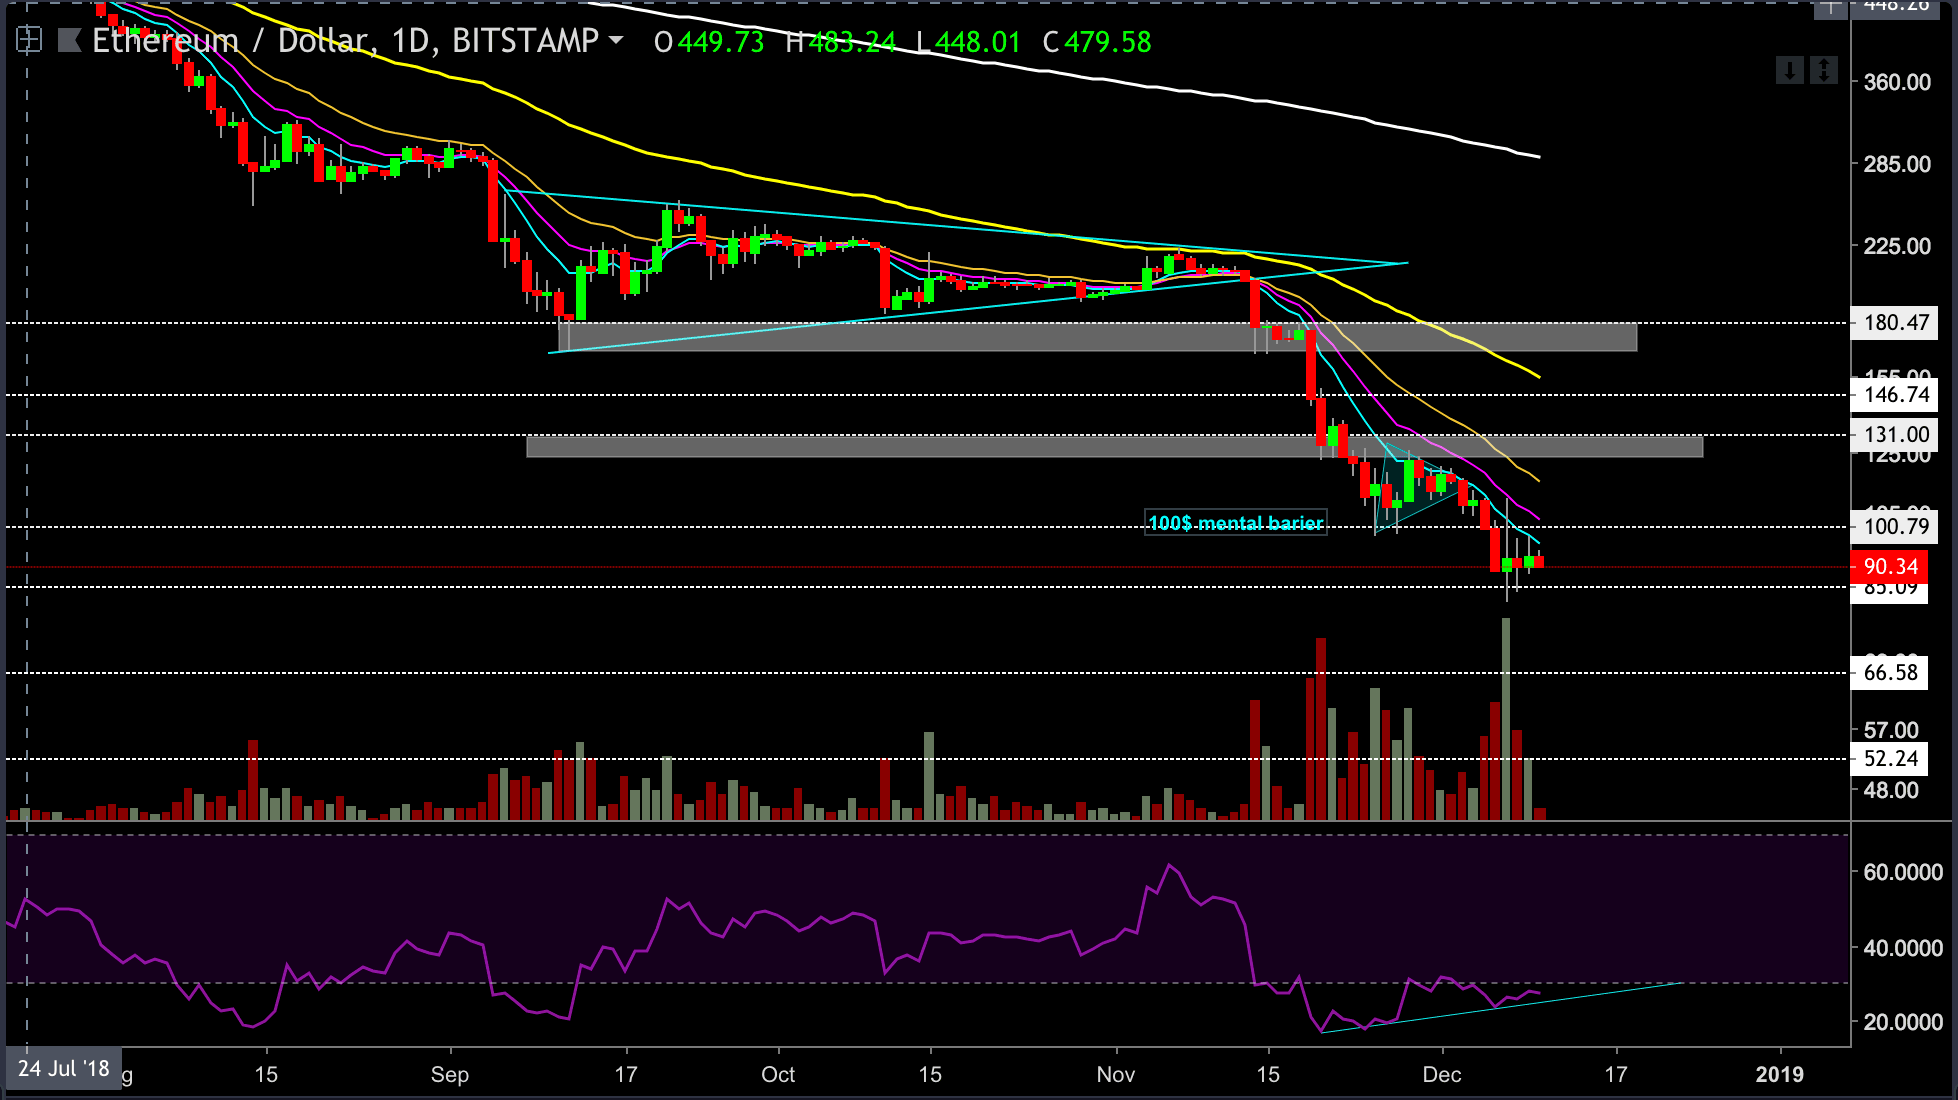
- On the daily chart, we can notice yesterday’s long Doji candle following decent green trading volume. This is a bullish sign; yet, we want to see that this candle’s low doesn’t break down for the next few days before the bulls can start smiling.
- The daily chart’s RSI is currently creating a positive diversion.
ETH/USD BitStamp 1-Hour Chart
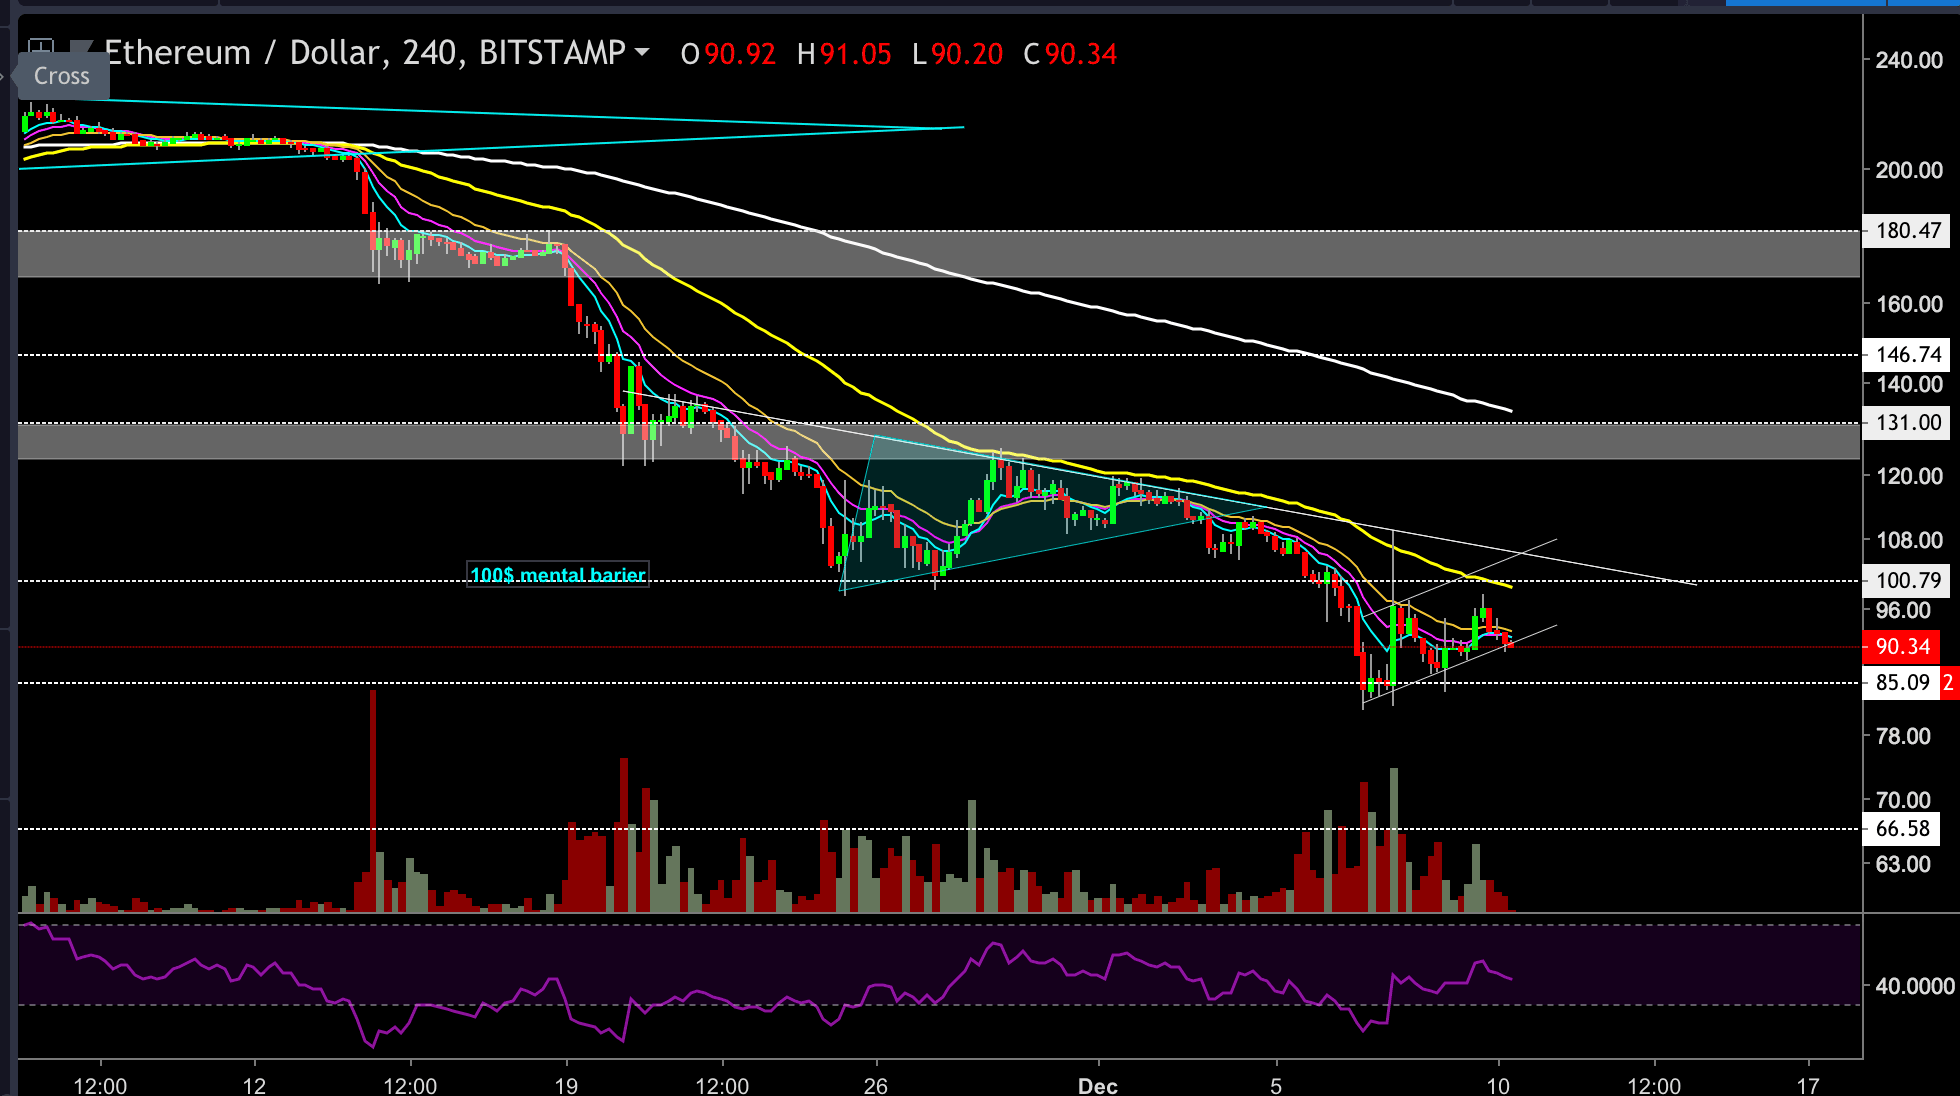
ETH/USD BitStamp 4-Hour Chart
ETH/USD BitStamp 1-Day Chart
Cryptocurrency charts by TradingView. Technical analysis tools by Coinigy.
SPECIAL OFFER (Sponsored)
Binance Free $600 (CryptoPotato Exclusive): Use this link to register new account and receive $600 exclusive welcome offer on Binance (
full details).
LIMITED OFFER 2024 for CryptoPotato readers at Bybit: Use this link to register and open a $500 BTC-USDT position on Bybit Exchange for free!
Disclaimer: Information found on CryptoPotato is those of writers quoted. It does not represent the opinions of CryptoPotato on whether to buy, sell, or hold any investments. You are advised to conduct your own research before making any investment decisions. Use provided information at your own risk. See Disclaimer for more information.