Ethereum marked a small increase of around 1% over the past 24 hours and it currently trades at $190. This allows ETH to grind its way higher toward the $200 level, and perhaps even more. However, it still needs to break above resistance at the 100-days EMA.
Ethereum remains the second-largest cryptocurrency as it holds a market cap of $20.74 billion.
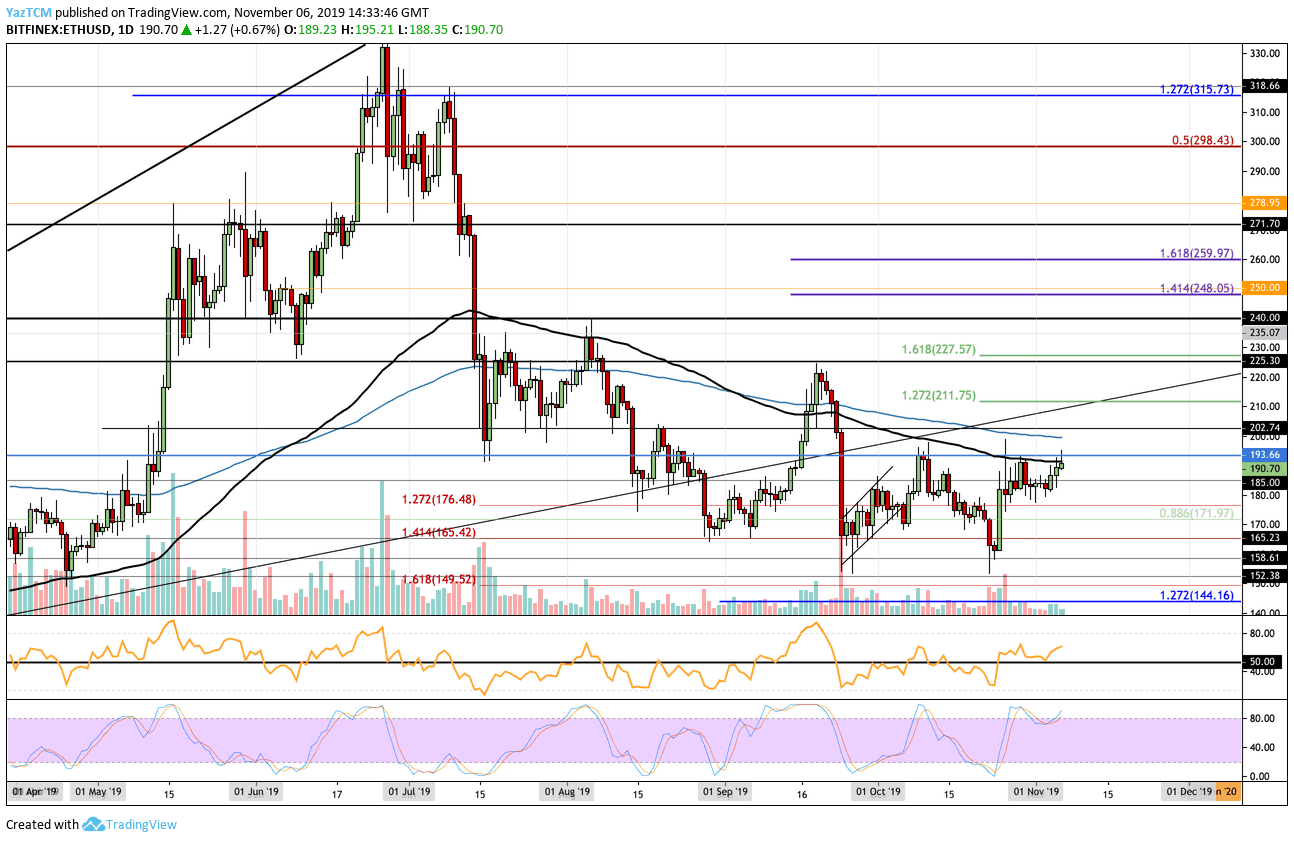
Looking at the ETH/USD 1-day chart:
- Since our previous ETH/USD analysis, the cryptocurrency fell into the support at $180 where it proceeded to rebound higher. ETH is trading at resistance provided by the 100-days EMA at $190.
- From above: The nearest level of resistance lies at the aforementioned $190 level. Above this, resistance is expected at $193.66 and $200, which is bolstered by the 200-days EMA. Above $200, resistance is at $202, $211.75, $220, and $225.
- From below: The nearest level of support lies at $185. Beneath this, support is found at $180, $176, $171.97, and $170. If ETH drops beneath $170, support can be expected at $165, $60, $158.60, and $152.38.
- The trading volume has remained relatively low during November.
- The RSI has recently bounced higher from the 50 level to show that the bulls are in control over the market momentum. If it can continue to rise higher, we should see ETH headed toward $200. However, we should remain cautious as the Stocahstic RSI is poised for a bearish crossover signal in overbought territory.
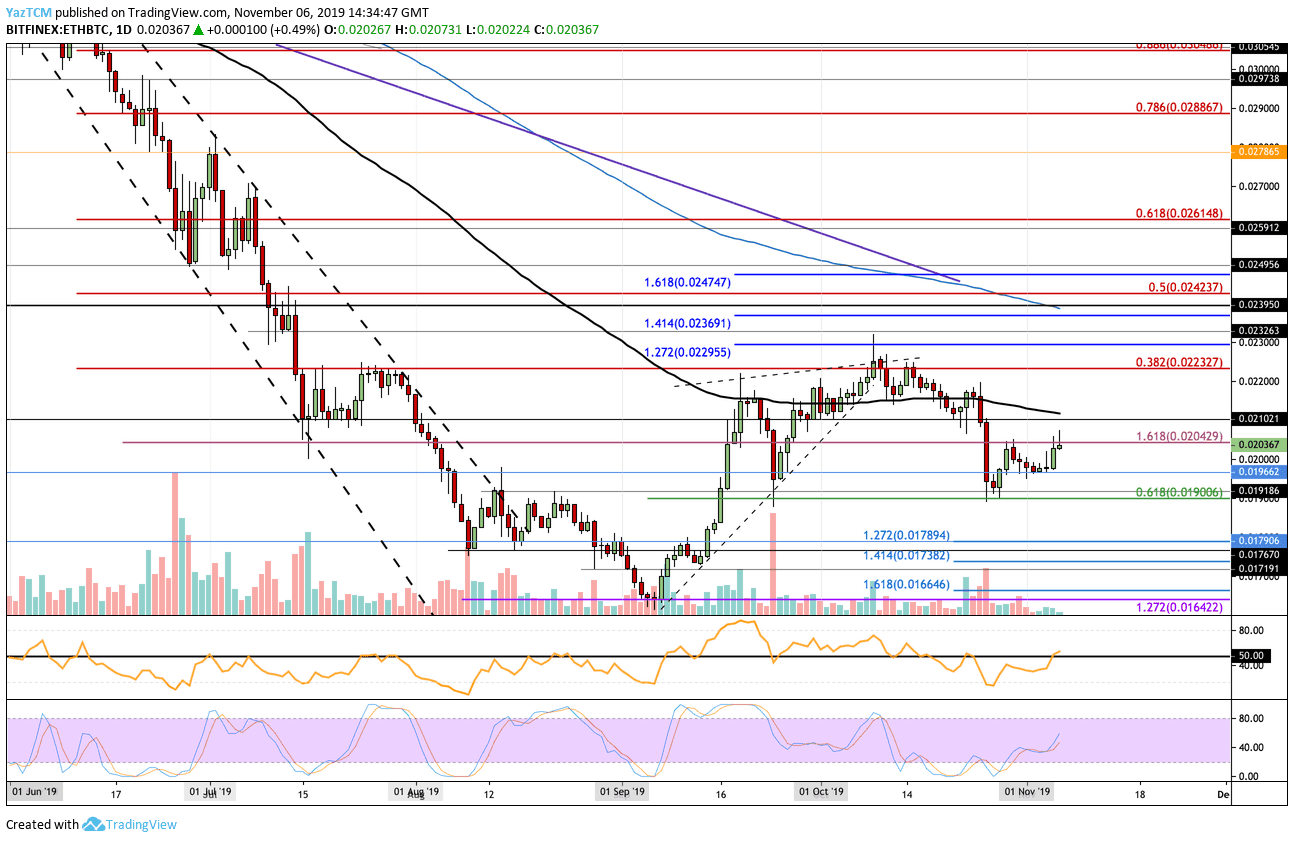
Looking at the ETH/BTC 1-day chart:
- Against BTC, ETH fell towards the support at the 0.01966 BTC level. It rebounded there as it now challenges the resistance at 0.020429 BTC.
- From above: The nearest level of resistance lies at 0.020429 BTC. Above this, resistance is at 0.021 BTC (100-days EMA), 0.0215 BTC, 0.022 BTC, and 0.02232 BTC (bearish .382 Fib Retracement). If the buying continues, higher resistance can be expected at 0.02295 BTC, 0.02326 BTC, 0.02369 BTC, and 0.02390 BTC (200-days EMA).
- From below: The nearest level of support lies at 0.020 BTC. Beneath this, support is found at 0.01966 BTC and 0.019 BTC (short term .618 Fib Retracement). If the selling continues, support is expected at 0.0185 BTC, 0.01789 BTC, 0.01760 BTC, 0.01738 BTC, and 0.017 BTC.
- The trading volume remains relatively low.
- The RSI has recently poked itself above the 50 level as the bulls attempt to gain control over the market momentum. If the RSI continues higher above 50, we will see ETH heading further higher above 0.021 BTC.
SPECIAL OFFER (Sponsored)
LIMITED OFFER 2024 for CryptoPotato readers at Bybit: Use this link to register and open a $500 BTC-USDT position on Bybit Exchange for free!
Disclaimer: Information found on CryptoPotato is those of writers quoted. It does not represent the opinions of CryptoPotato on whether to buy, sell, or hold any investments. You are advised to conduct your own research before making any investment decisions. Use provided information at your own risk. See Disclaimer for more information.
Cryptocurrency charts by TradingView.