Ethereum has recently fallen back toward the $250 support level after dropping by 1% over the past 24 hours. The cryptocurrency has now officially seen a stagnant period of trading during the past 30 days as the price has declined by roughly around 3.44%.
Regardless of the recent price declines, Ethereum has still seen a remarkable 81.44% surge over the past 3 months. However, ETHBTC has also slipped beneath a major level of support and if it breaks beneath 0.03 BTC we could see it falling further lower.
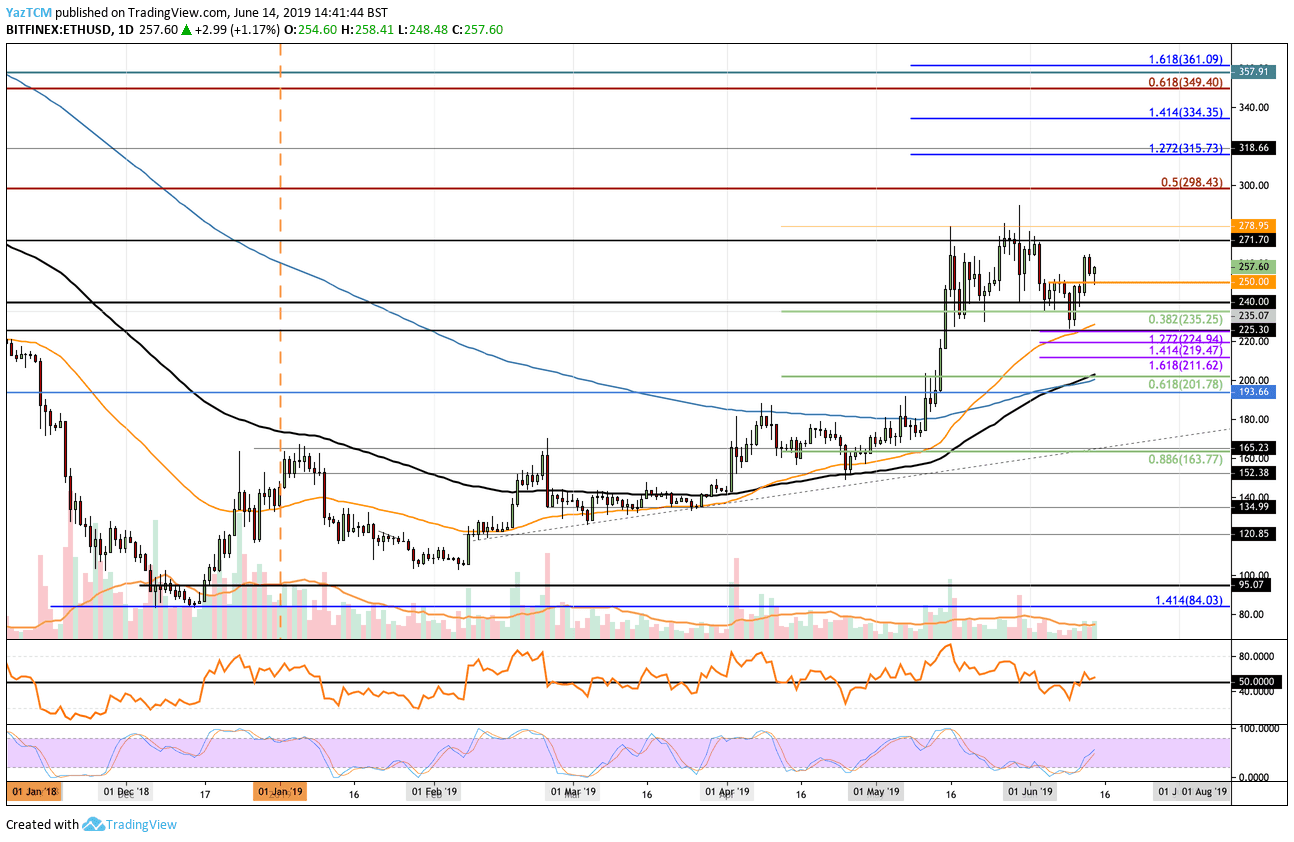
Looking at the ETH/USD 1-Day Chart:
- Since our previous ETH/USD analysis, we can see that Ethereum was unable to stand its ground above the $260 level and has recently slipped to where it is currently trading at $257.
- From above: The nearest level of resistance above $260 lies between $271 and $278. This price range had caused problems for ETH during May 2019 and is expected to provide strong resistance moving forward. Above $280, the next level of resistance lies between $298 and $300 – where lies the bearish .5 Fib Retracement. Above $300, higher resistance lies at $315, $334, and $350.
- From below: The nearest level of support now lies at $250. Beneath this, further support is found at $240 and $235. If the price drops beneath $225, support is found at $220, $211, and $200.
- The trading volume has increased above average during the past few days of trading.
- The Stochastic RSI has recently produced a bullish crossover which has resulted in the rebound from $225. If the Stochastic RSI can continue to expand, we can expect ETHUSD to climb further.
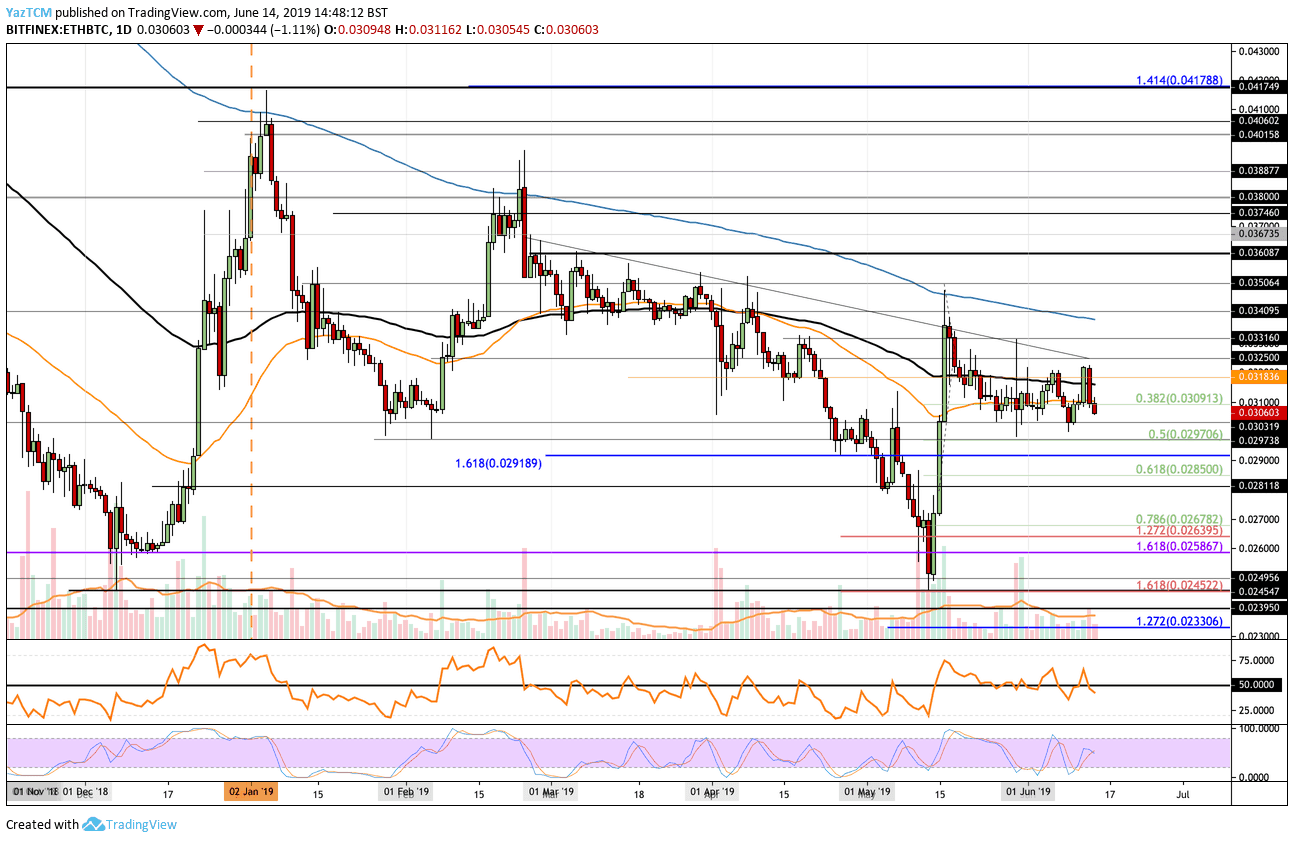
Looking at the ETH/BTC 1-Day Chart:
- Against Bitcoin, we can see that ETH has now dropped beneath the strong support at 0.0309 BTC (short term .382 Fib) to fall to where it currently trades at 0.00306 BTC.
- From above: The nearest level of resistance lies at 0.031 BTC. Above this, higher resistance lies at 0.03183 BTC, 0.0325 BTC, 0.03315 BTC, and 0.034 BTC.
- From below: The nearest level of support now lies at 0.0303 BTC and 0.030 BTC. Beneath 0.03 BTC, further support lies at 0.02970 BTC, 0.02918 BTC, and 0.0285 BTC.
- The trading volume has remained below average during June but is also relatively high.
- The RSI itself has recently slipped beneath the 50 level to indicate that the sellers are in control of the market momentum.
SPECIAL OFFER (Sponsored)
Binance Free $600 (CryptoPotato Exclusive): Use this link to register new account and receive $600 exclusive welcome offer on Binance (
full details).
LIMITED OFFER 2024 for CryptoPotato readers at Bybit: Use this link to register and open a $500 BTC-USDT position on Bybit Exchange for free!
Disclaimer: Information found on CryptoPotato is those of writers quoted. It does not represent the opinions of CryptoPotato on whether to buy, sell, or hold any investments. You are advised to conduct your own research before making any investment decisions. Use provided information at your own risk. See Disclaimer for more information.
Cryptocurrency charts by TradingView.