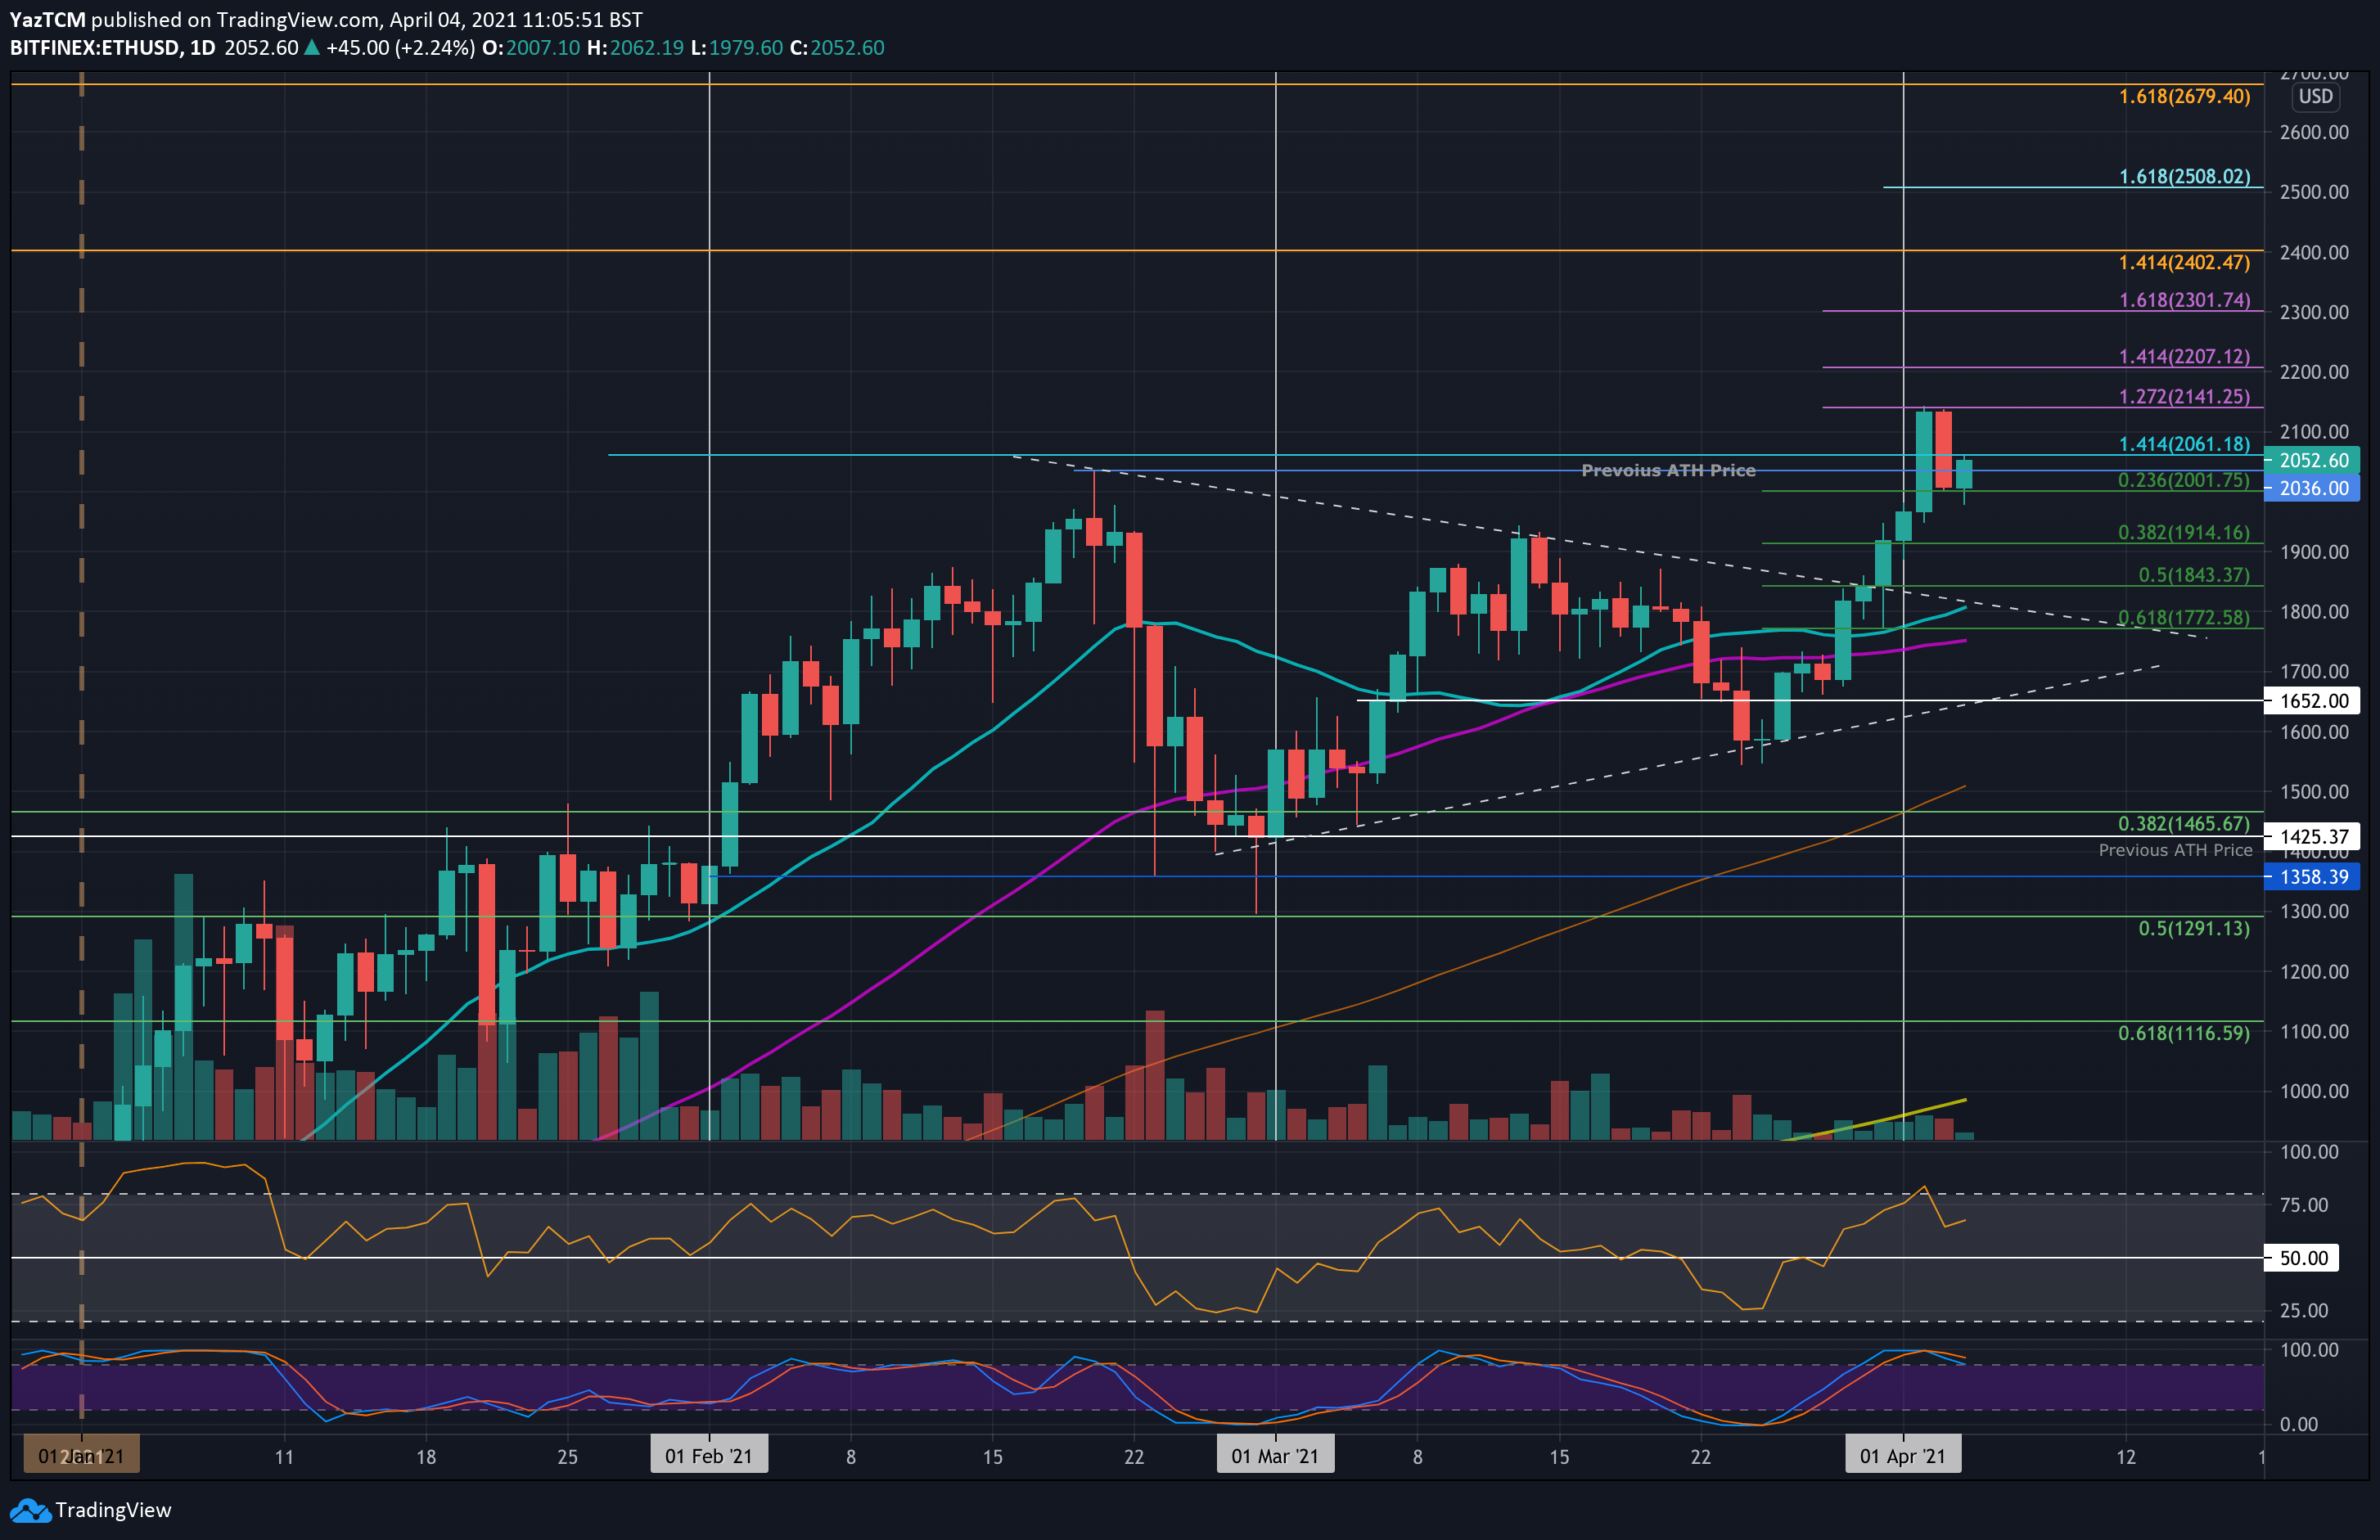
ETH/USD Daily Chart. Source: TradingView
Key Support Levels: $2000, $1914, $1840.
Key Resistance Levels: $2060, $2141, $2207.
Ethereum started the month off on an extremely bullish tone as it pushed above $2000 to set a new ATH at $2141. There, it ran into resistance at a 1.272 Fib Extension level and was unable to break above it. As a result, it rolled over yesterday and headed lower.
Today, ETH managed to find support at $2000, provided by a .236 Fib Retracement level. It has since rebounded from this support and is starting to push higher again.
Looking ahead, the first level of resistance lies at $2060. This is followed by $2141 (ATH Price & 1.272 Fib Extension), $2207 (1.414 Fib Extension), and $2300 (1.618 Fib Extension). Additional resistance lies at $2400 and $2500.
On the other side, the first support lies at $2000 (.236 Fib). This is followed by $1914 (.382 Fib), $1840 (.4 Fib), and $1770 (.618 Fib).
The daily RSI has dropped slightly from extremely overbought conditions but still remains strong in the bullish favor. This allowed the buyers to recover before pushing upward again back toward the ATH prices.
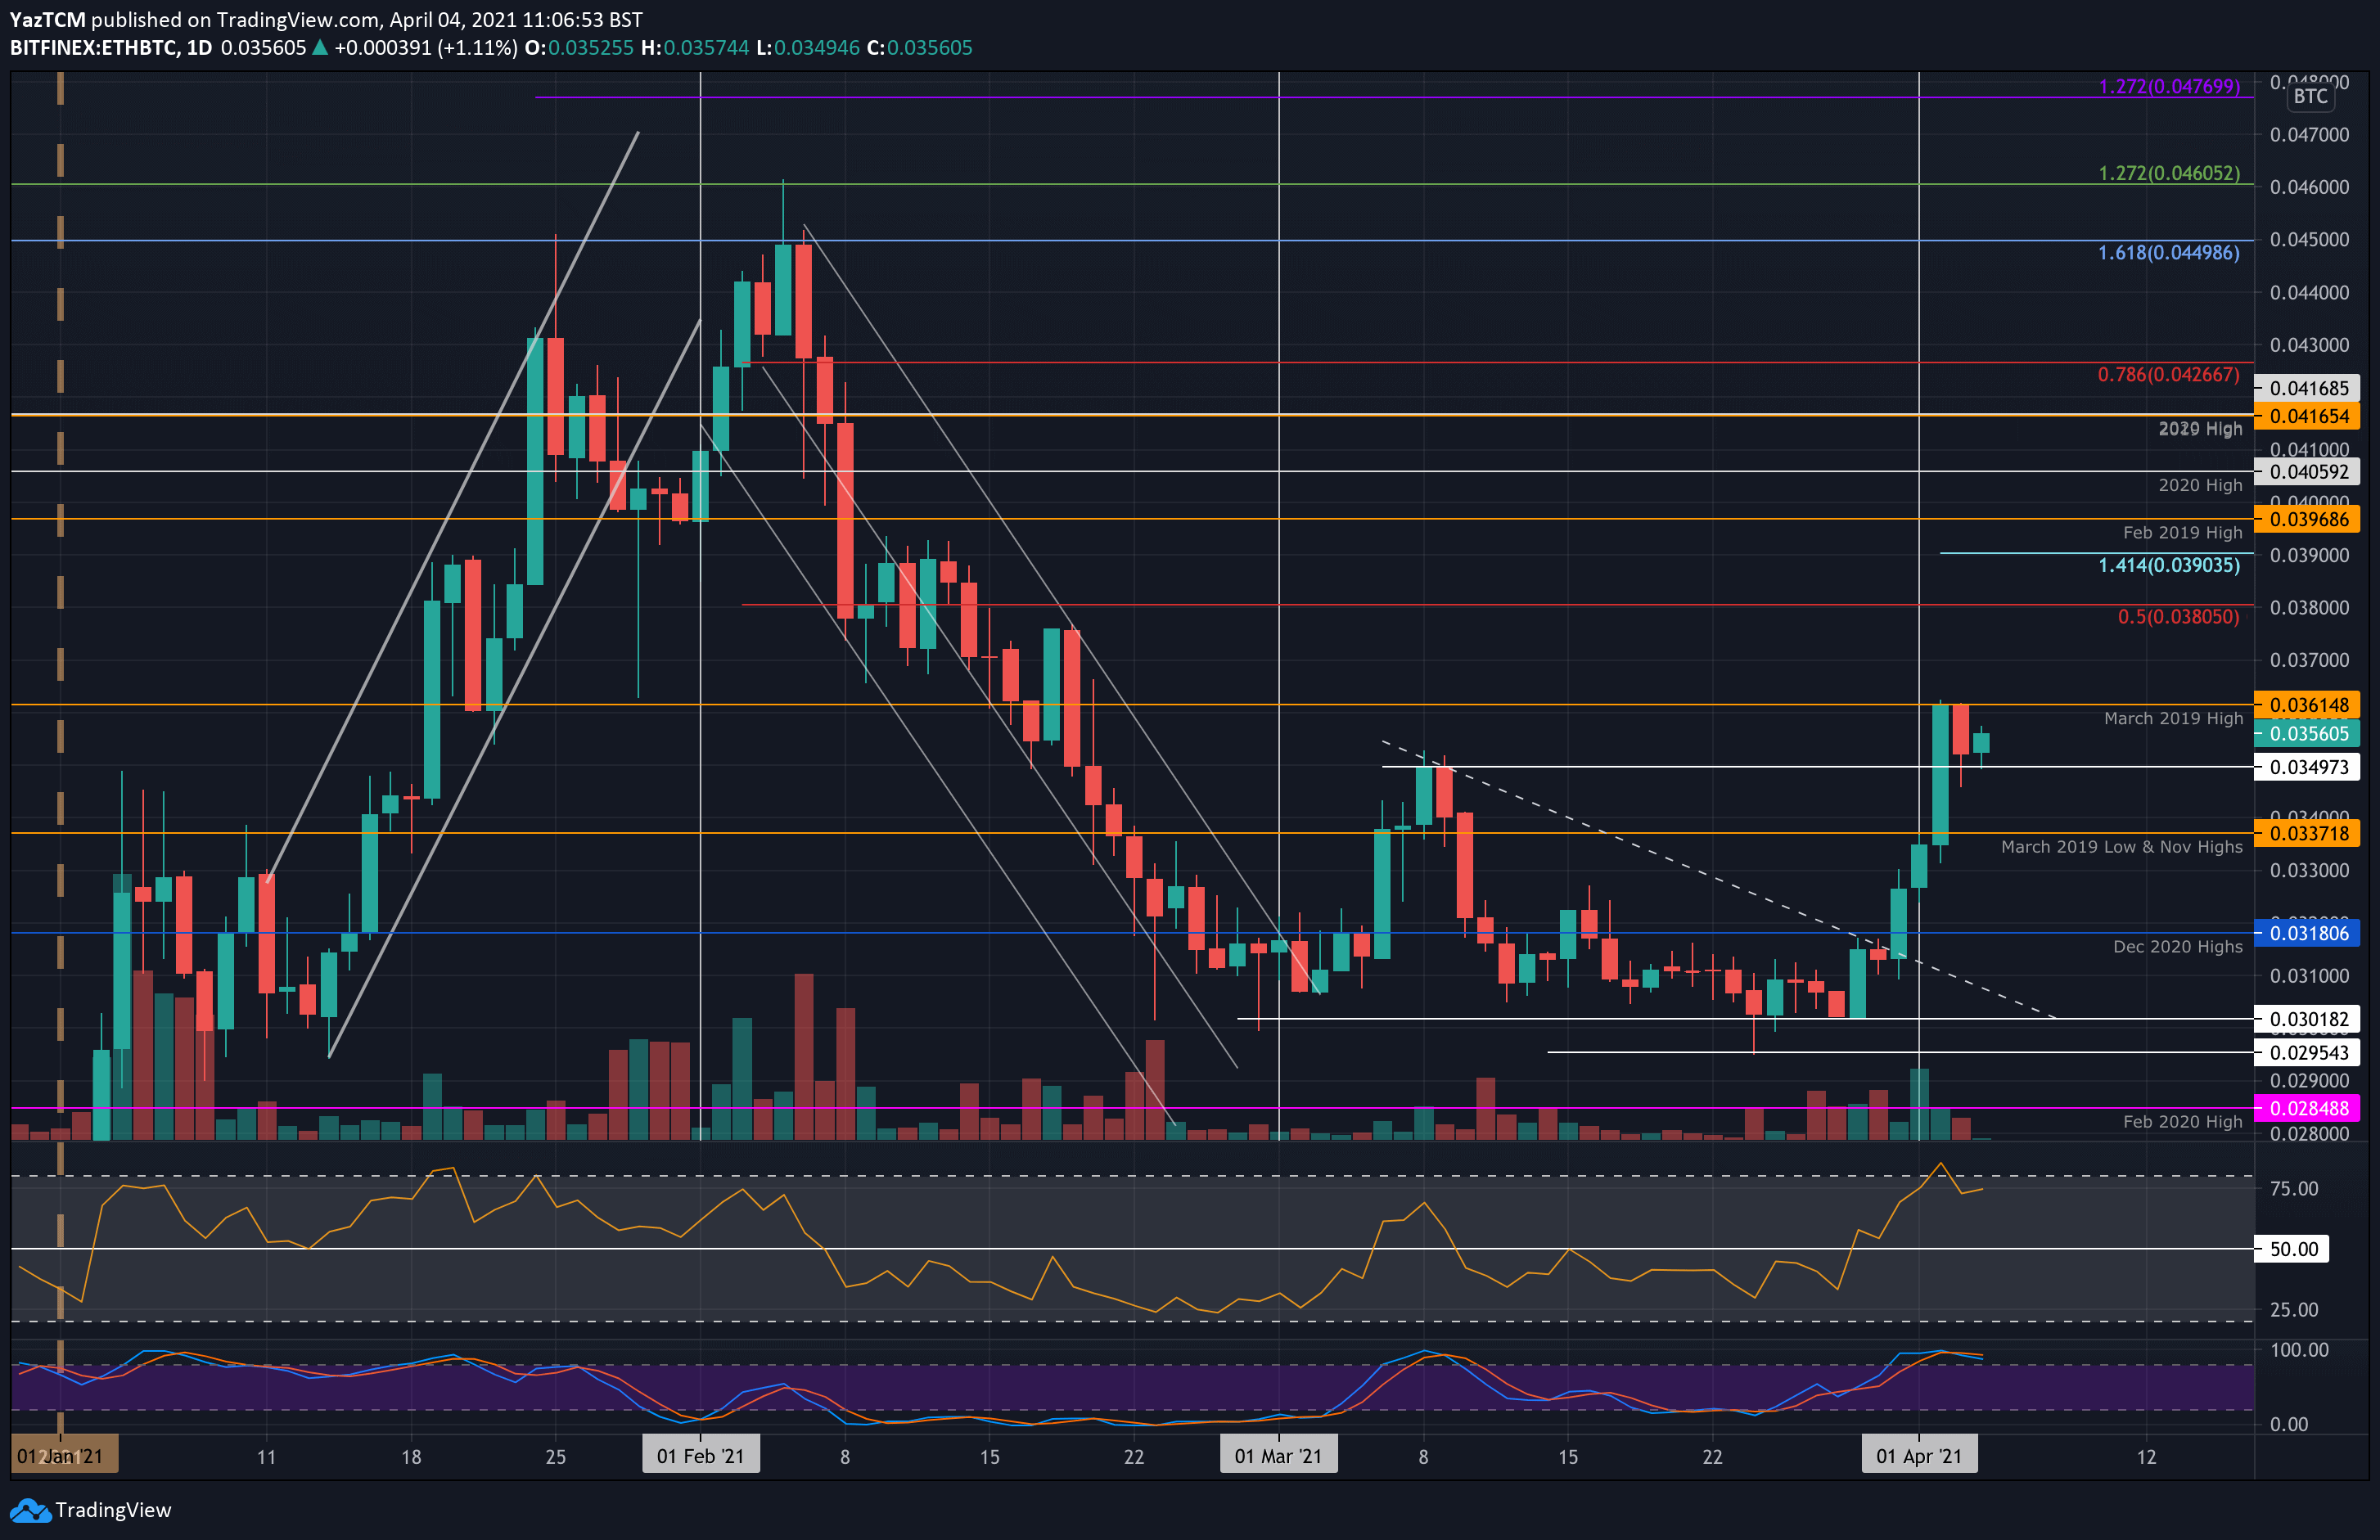
Key Support Levels: 0.035 BTC, 0.0337 BTC, 0.033 BTC.
Key Resistance Levels: 0.0361 BTC, 0.037 BTC, 0.038 BTC.
Ethereum also started the month very strongly against Bitcoin. The coin rebounded from support at 0.03 BTC last week and pushed higher above 0.033 BTC at the beginning of April.
The buyers continued to drive ETH higher until they reached resistance at 0.0361 BTC (March 2019 Highs) on Friday. It rolled over from there yesterday, but the bulls defended the support at 0.035 BTC and have since rebounded from there today as they trade at 0.0356 BTC.
Looking ahead, the first level of resistance lies at 0.0361 BTC (March 2019 Highs). This is followed by 0.037 BTC, 0.038 BTC (Bearish .5 Fib), and 0.039 BTC (1.414 Fib Extension).
On the other side, the first support lies at 0.035 BTC. This is followed by 0.0337 BTC (Nov 2020 Highs), 0.033 BTC, and 0.0318 BTC (Dec 2020 Highs).
Likewise, the RSI dropped slightly from overbought conditions, allowing the buyers some breathing space before the next leg higher.