Ethereum continues its crashing, especially against Bitcoin, after losing a total of 6% over the past 24 hours. The current price is around $165. As mentioned, the sharp decrease in price is mostly a result of ETH/BTC falling further lower into the 0.030 BTC support region.
Despite the recent price declines, Etehreum is still up by 20% over the past 30 days and is up by a further 40% over the past 90 days, against the USD.
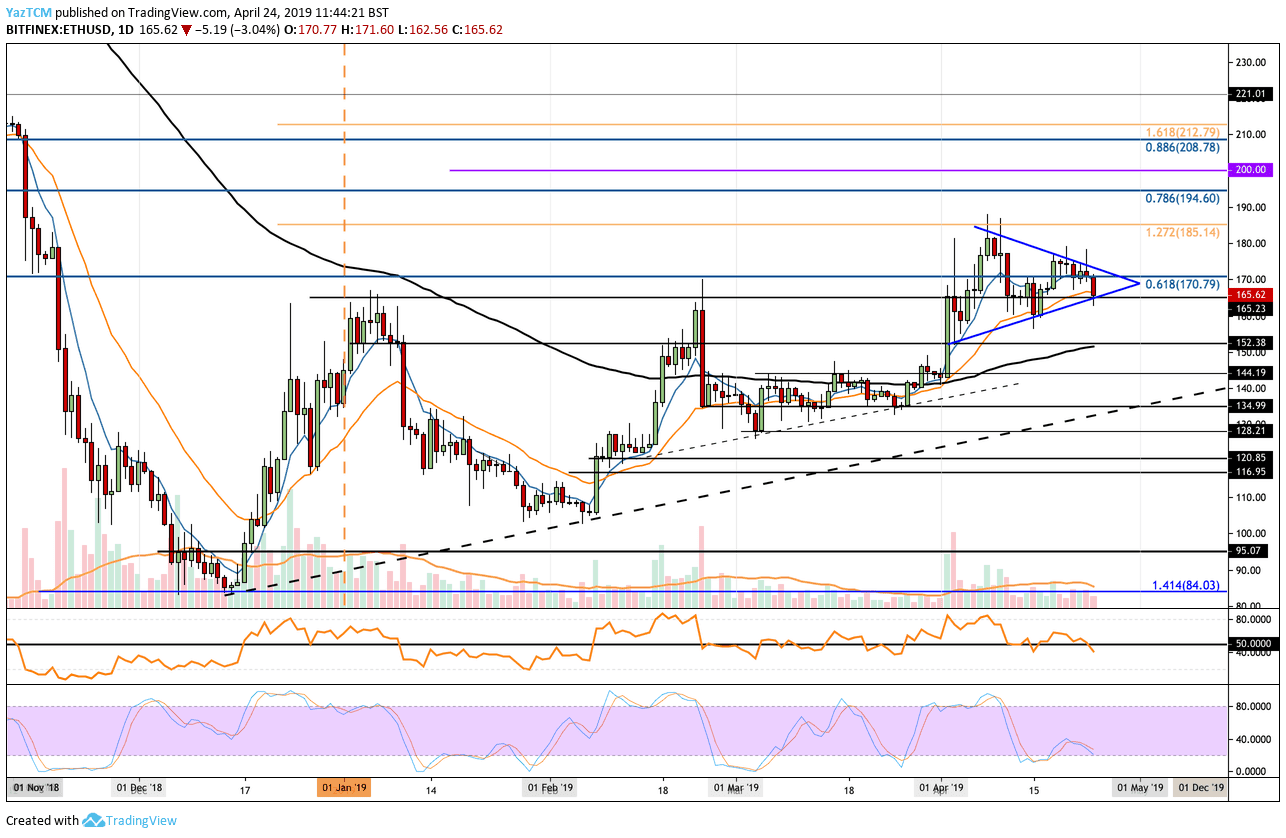
Looking at the ETH/USD 1-Day Chart:
- Since our previous ETH/USD analysis, we can see that the market has fallen into support at the $165 level. For the majority of April 2019, we can see Ethereum has been trading within short-term symmetrical triangle formation. The recent price drop has now caused ETH/USD to fall into support at the lower boundary of the triangle.
- From above: The nearest levels of resistance lies at $170 which contains a long term bearish .618 Fibonacci Retracement level. Resistance above this is then located at the upper boundary of the triangle. Further resistance levels then lie at $185, $194 and $200.
- From below: If ETH/USD falls beneath the triangle, we can expect support at $160. Beneath is the $152 and $150 areas, which is further bolstered by the 100-days moving average line. Further support lies at $144 and $134.
- The trading volume has started to increase during this round of selling which indicates that bears are in control.
- The RSI has recently dipped below the 50 levels, which is bearish as well.
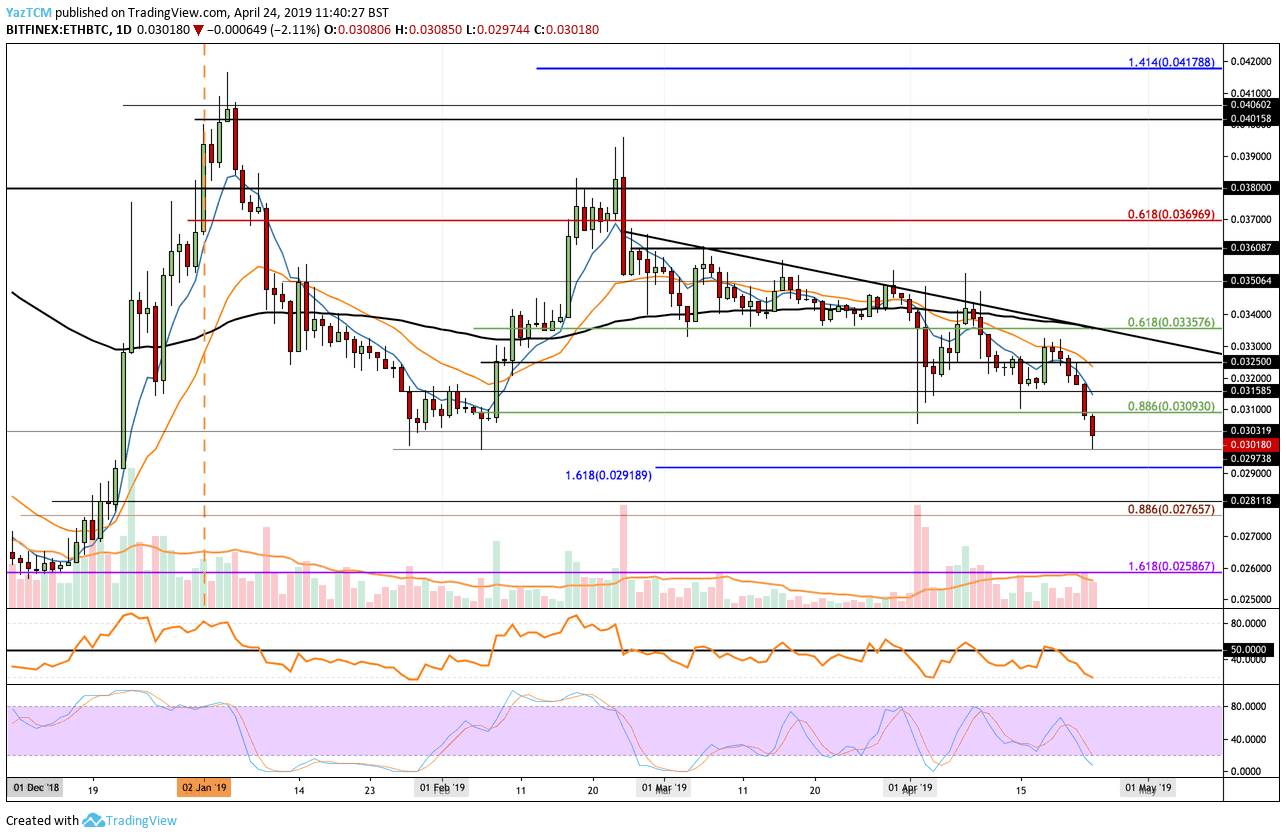
Looking at the ETH/BTC 1-Day Chart:
- Following our previous ETH/BTC, we can see that Ethereum has fallen significantly further against Bitcoin. The market has now fallen into the 0.030 BTC significant support level which was also the 2019 low from the end of January.
- From above: The nearest levels of resistance now lie at 0.031 BTC and 0.0325 BTC.
- From below: If the sellers push ETH/BTC beneath the 0.030 BTC support level, further support lies at 0.02920 BTC, which contains a downside 1.618 Fibonacci Extension level. Below this, more support can then be expected at 0.028 BTC and 0.0275 BTC.
- The RSI is far beneath the 50 level which shows that the bears are in total control of market momentum. The Stochastic RSI is in an oversold area.
SPECIAL OFFER (Sponsored)
LIMITED OFFER 2024 for CryptoPotato readers at Bybit: Use this link to register and open a $500 BTC-USDT position on Bybit Exchange for free!
Disclaimer: Information found on CryptoPotato is those of writers quoted. It does not represent the opinions of CryptoPotato on whether to buy, sell, or hold any investments. You are advised to conduct your own research before making any investment decisions. Use provided information at your own risk. See Disclaimer for more information.
Cryptocurrency charts by TradingView.