Ethereum has had a rough week after dropping by 8%, bringing the current trading price down to around $166. The market is struggling to make a movement above the present resistance of the $170 area.
Despite the recent turbulence, Ethereum remains up by 19% over the past 30 days and up by 36% over the past 90 days. Ethereum currently holds a $17.55 billion market cap valuation which places the smart contract project in the second place of the top cryptocurrencies by market cap.
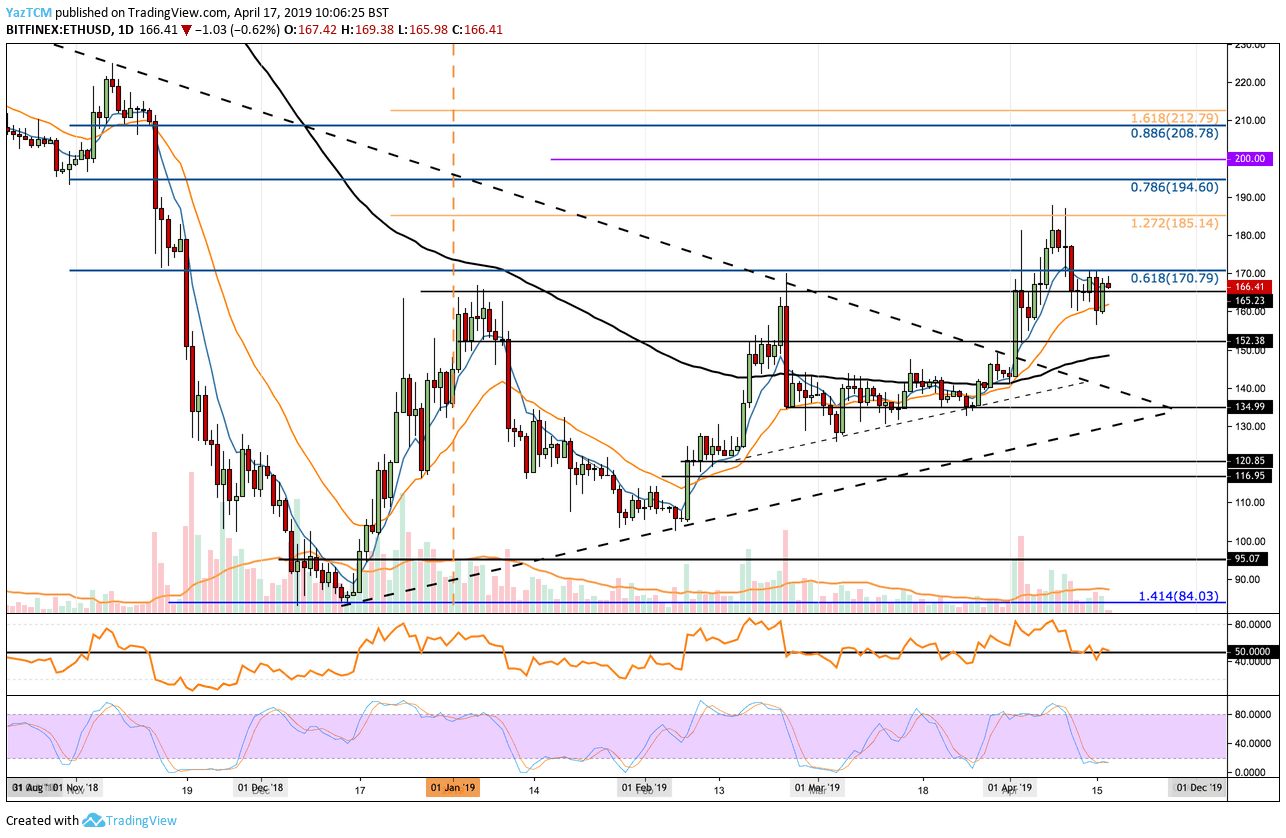
Looking at the ETH/USD 1-Day Chart:
- Since our previous ETH/USD analysis, we can see that the market continues to struggle to break above the resistance of $170.80, where lies the bearish .618 Fibonacci Retracement level. This retracement is measured from the November 2018 high, before Bitcoin’s price had collapsed from the $6000, to the December 2018 low of $3120. We can see the market had recently dropped toward support at $160 before bouncing back higher.
- From above: The nearest level of resistance is located at $170. Above this, higher resistance lies at the $185 level, which contains a 1.272 Fibonacci Extension level. Above $180, further resistance is expected at $194.60, where lies the bearish .786 Fibonacci Retracement and then at the $200 significant resistance level.
- From below: The nearest level of support lies at $160. Beneath this, further support can be located at $152 and then the 100-days moving average around $150. Further support lies at $140 and $135.
- The trading volume has been steadily decreasing throughout April as the bullish run settles down.
- The Stochastic RSI is positioned for a crossover above which would indicate that the bullish pressure may about to increase. The RSI is trading along with the 50 level which is a sign that the market is indecisive about which direction to head at.
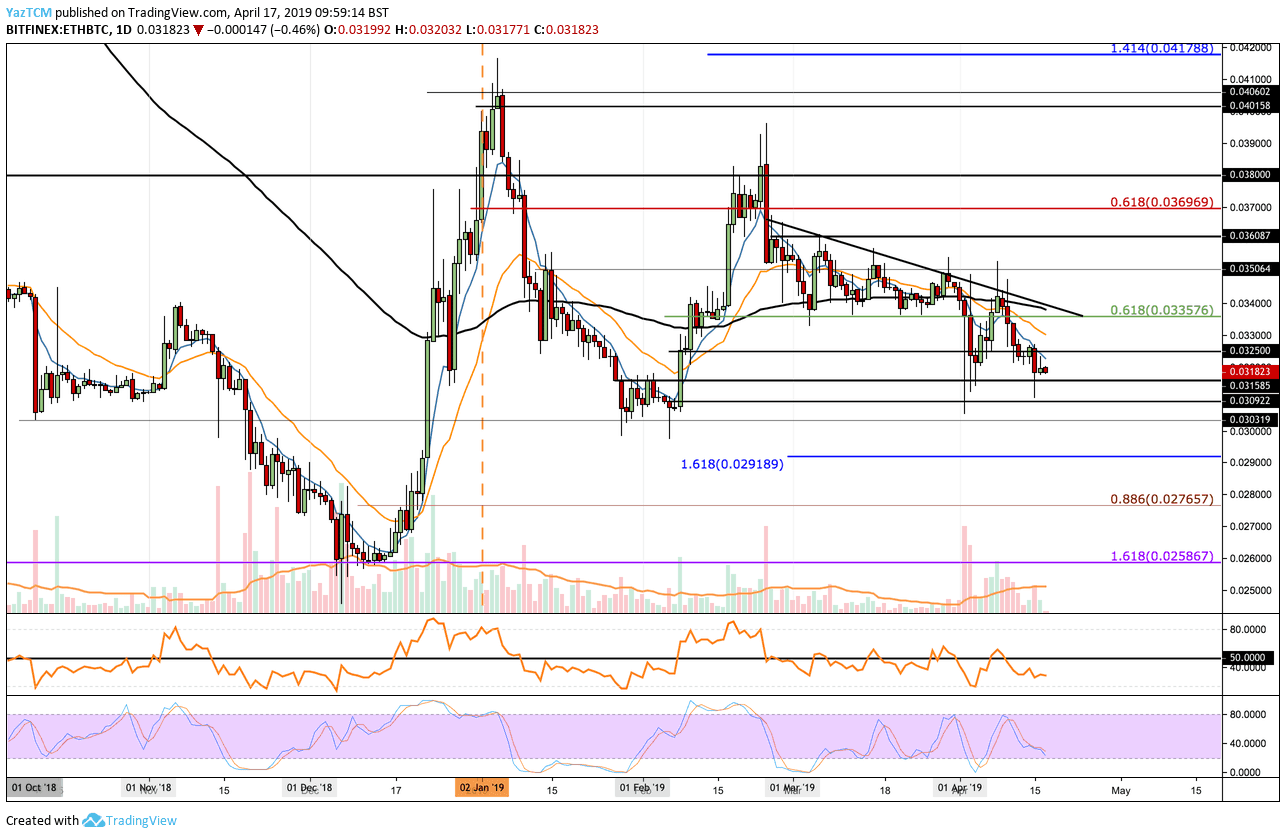
Looking at the ETH/BTC 1-Day Chart:
- Following our previous ETH/BTC analysis, against Bitcoin, we can see that ETH has fallen even lower into the 0.03180 BTC area. The coin had struggled to break above a descending triangle formation during March 2019 and has plummeted through the bottom of this wedge.
- From above: The nearest level of resistance lies at 0.0325 BTC. Above this, further resistance is at 0.0335 BTC, which was the base of the mentioned descending triangle along with the 100-day moving average line.
- From below: The nearest level of support lies at 0.0315 BTC. Beneath, further support can be expected at 0.030 BTC which is the October 2018 low. Beneath 0.030 BTC, more support lies at a 0.0291 BTC which contains a downside 1.618 Fibonacci Extension level.
- The trading volume has decreased since the start of the month but has started to show signs of increasing.
- The RSI lies below the 50 levels as the bears take charge of the momentum.
SPECIAL OFFER (Sponsored)
LIMITED OFFER 2024 for CryptoPotato readers at Bybit: Use this link to register and open a $500 BTC-USDT position on Bybit Exchange for free!
Disclaimer: Information found on CryptoPotato is those of writers quoted. It does not represent the opinions of CryptoPotato on whether to buy, sell, or hold any investments. You are advised to conduct your own research before making any investment decisions. Use provided information at your own risk. See Disclaimer for more information.
Cryptocurrency charts by TradingView.