Key Support Leves: $225, $215, $210.
Key Resistance Levels: $245, $250, $265.
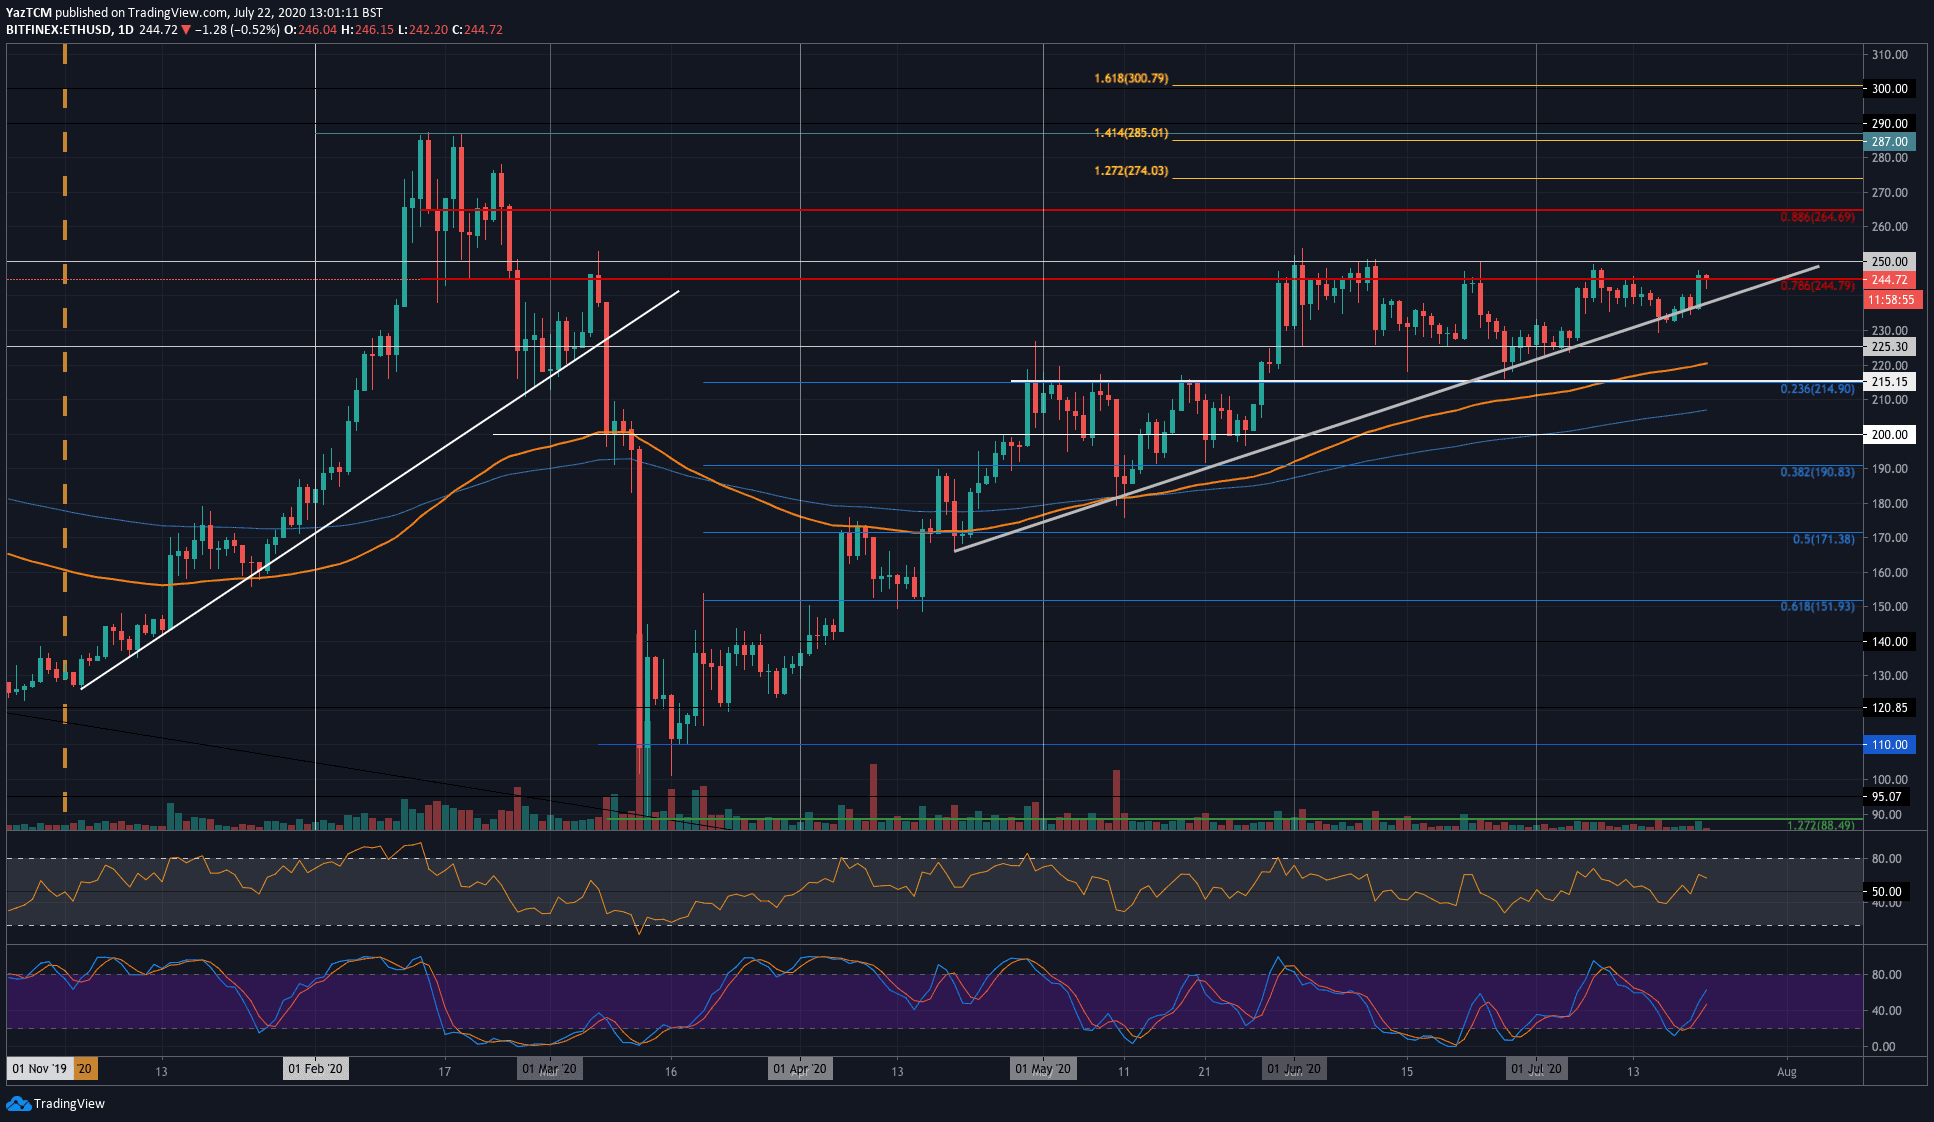
Ethereum was trading at the lower boundary of an ascending triangle pattern earlier in the weekend. From there, it rebounded and pushed higher to reach the current resistance at $245 (bearish .786 Fib Retracement).
ETH has been trapped in this ascending triangle pattern since the start of May and must push above the upper boundary at $250 to kick off a fresh bullish run.
Looking ahead, if the buyers push higher, the first level of resistance lies at $245. Above this, strong resistance lies at $250, $265 (bearish .886 Fib Retracement), and $275 (1.272 Fib Extension).
On the other side, the first level of support lies at the lower boundary of the triangle. Beneath this, added support is found at $225, $215 (.236 Fib Retracement), and $200.
The RSI recently pushed back above the 50 line to indicate that the bulls have taken control of the market momentum. Additionally, the Stochastic RSI produced a bullish crossover signal, which should help to push the market higher.
Key Support Levels: 0.026 BTC, 0.0253 BTC, 0.025 BTC.
Key Resistance Levels: 0.0263 BTC, 0.0266 BTC, 0.027 BTC.
Against Bitcoin, ETH rebounded from the 0.0253 BTC support during the weekend and pushed higher to retest the 0.0263 BTC resistance yesterday.
ETH has struggled at 0.0263 BTC during July and must overcome this resistance to push toward the 2020 high at 0.0278 BTC.
Moving forward, if the bulls can break resistance at 0.0263 BTC, higher resistance lies at 0.0266 BTC (bearish .886 Fib Retracement), 0.027 BTC, and 0.0273 BTC (1.414 Fib Extension). This is followed by added resistance at 0.0278 BTC (2020 high).
On the other side, the first level of support lies at 0.026 BTC. Beneath this, support is located at 0.0253 BTC, 0.0249 BTC (.236 Fib Retracement), and 0.02411 (.382 Fib Retracement).
Likewise, the RSI pushed above 50 as the buyers take control of the market momentum, and the Stochastic RSI produced a bullish crossover signal.