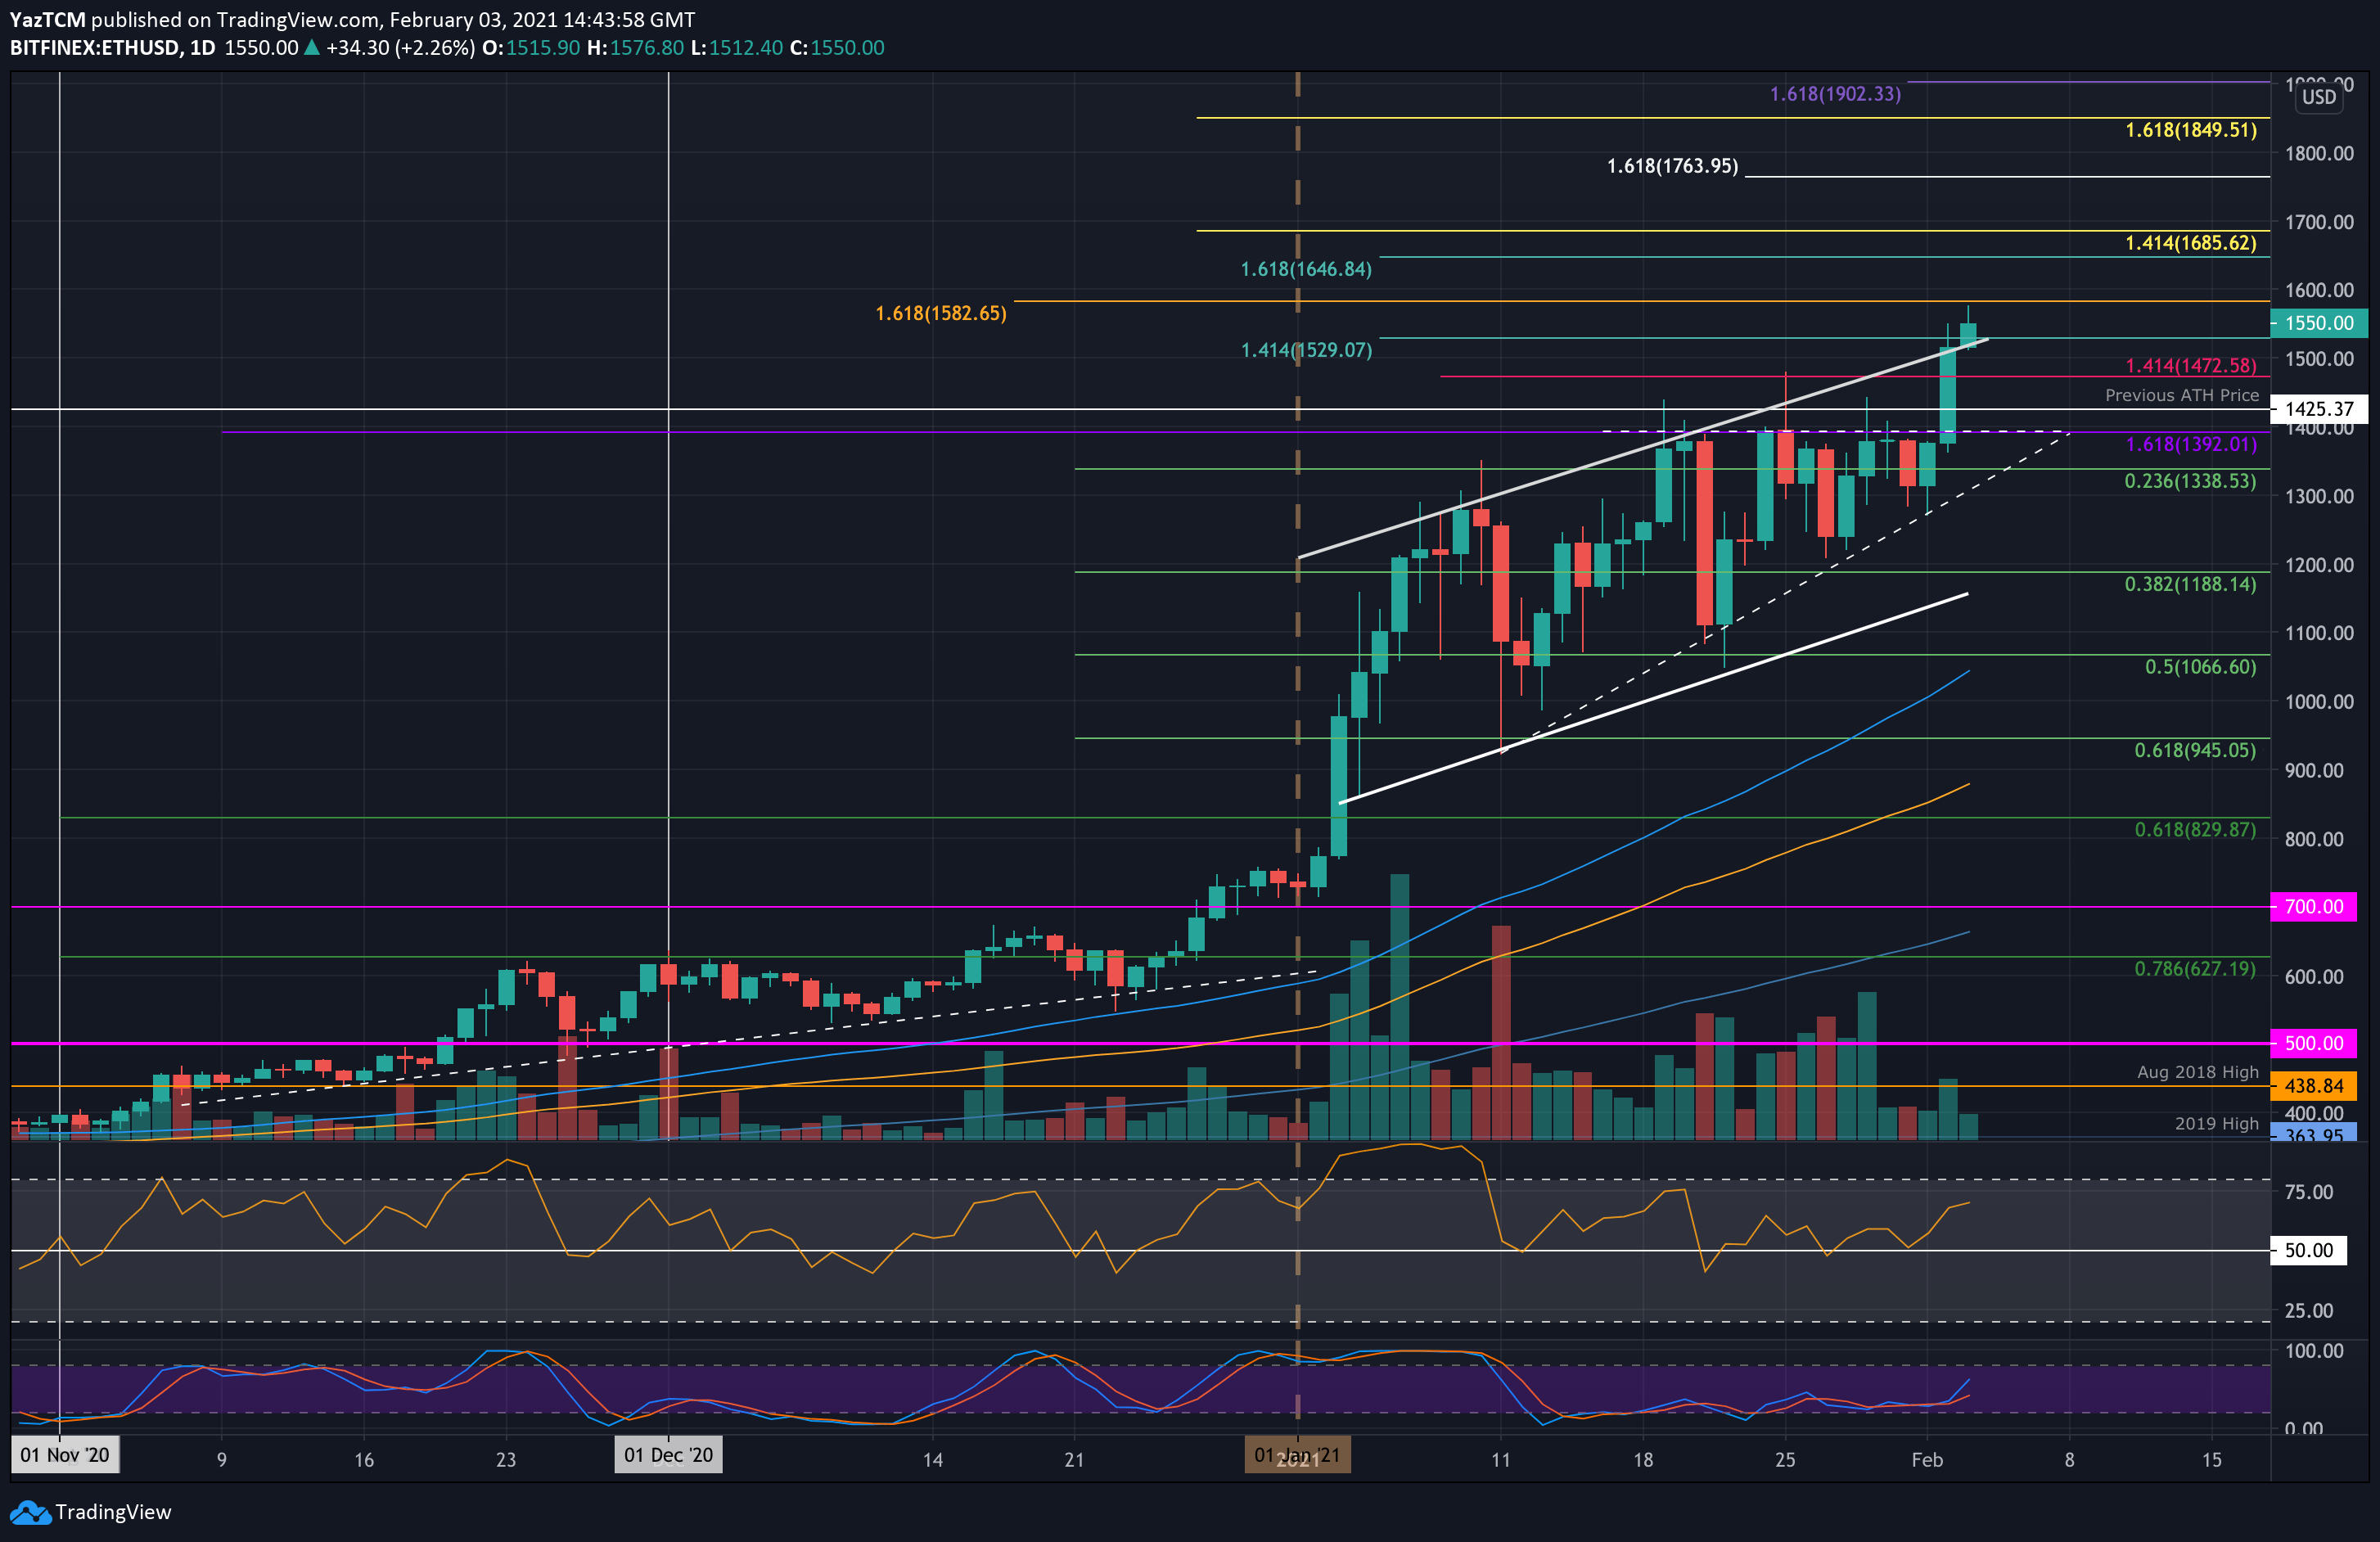
ETH/USD Daily Chart. Source: TradingView
Key Support Levels: $1500, $1425, $1392.
Key Resistance Levels: $1576, $1600, $1646.
Ethereum finally penetrated resistance at $1390 yesterday, the roof of a symmetrical triangle pattern. The coin had been knocking on the resistance on numerous occasions over the past week and finally managed to close a daily candle above it as it reached above $1500 yesterday.
Today, Ethereum continued with the bullish momentum as it set a new ATH price at $1576.80, according to Bitstamp. The coin has also managed to break resistance at the upper boundary of a rising price channel. If it can close above this resistance today, the market is likely to turn parabolic and head above $1800 next.
Looking ahead, the first resistance lies at the $1576.60 ATH price. This is followed by $1600, $1646 (1.618 Fib Extension), $1685 (1.414 Fib Extension), and $1763 (1.618 Fib Extension – white).
Added resistance lies at $1800 and $1850.
On the other side, the first support lies at $1500. This is followed by $1425 (previous ATH), $1392 (January resistance), and $1338 (.236 Fib). Added support lies at $1300 and $1188 (.382 Fib).
The Daily RSI has pushed past the 60 level and is heading toward overbought conditions but still has much room to allow ETH to continue higher before becoming extremely overbought.
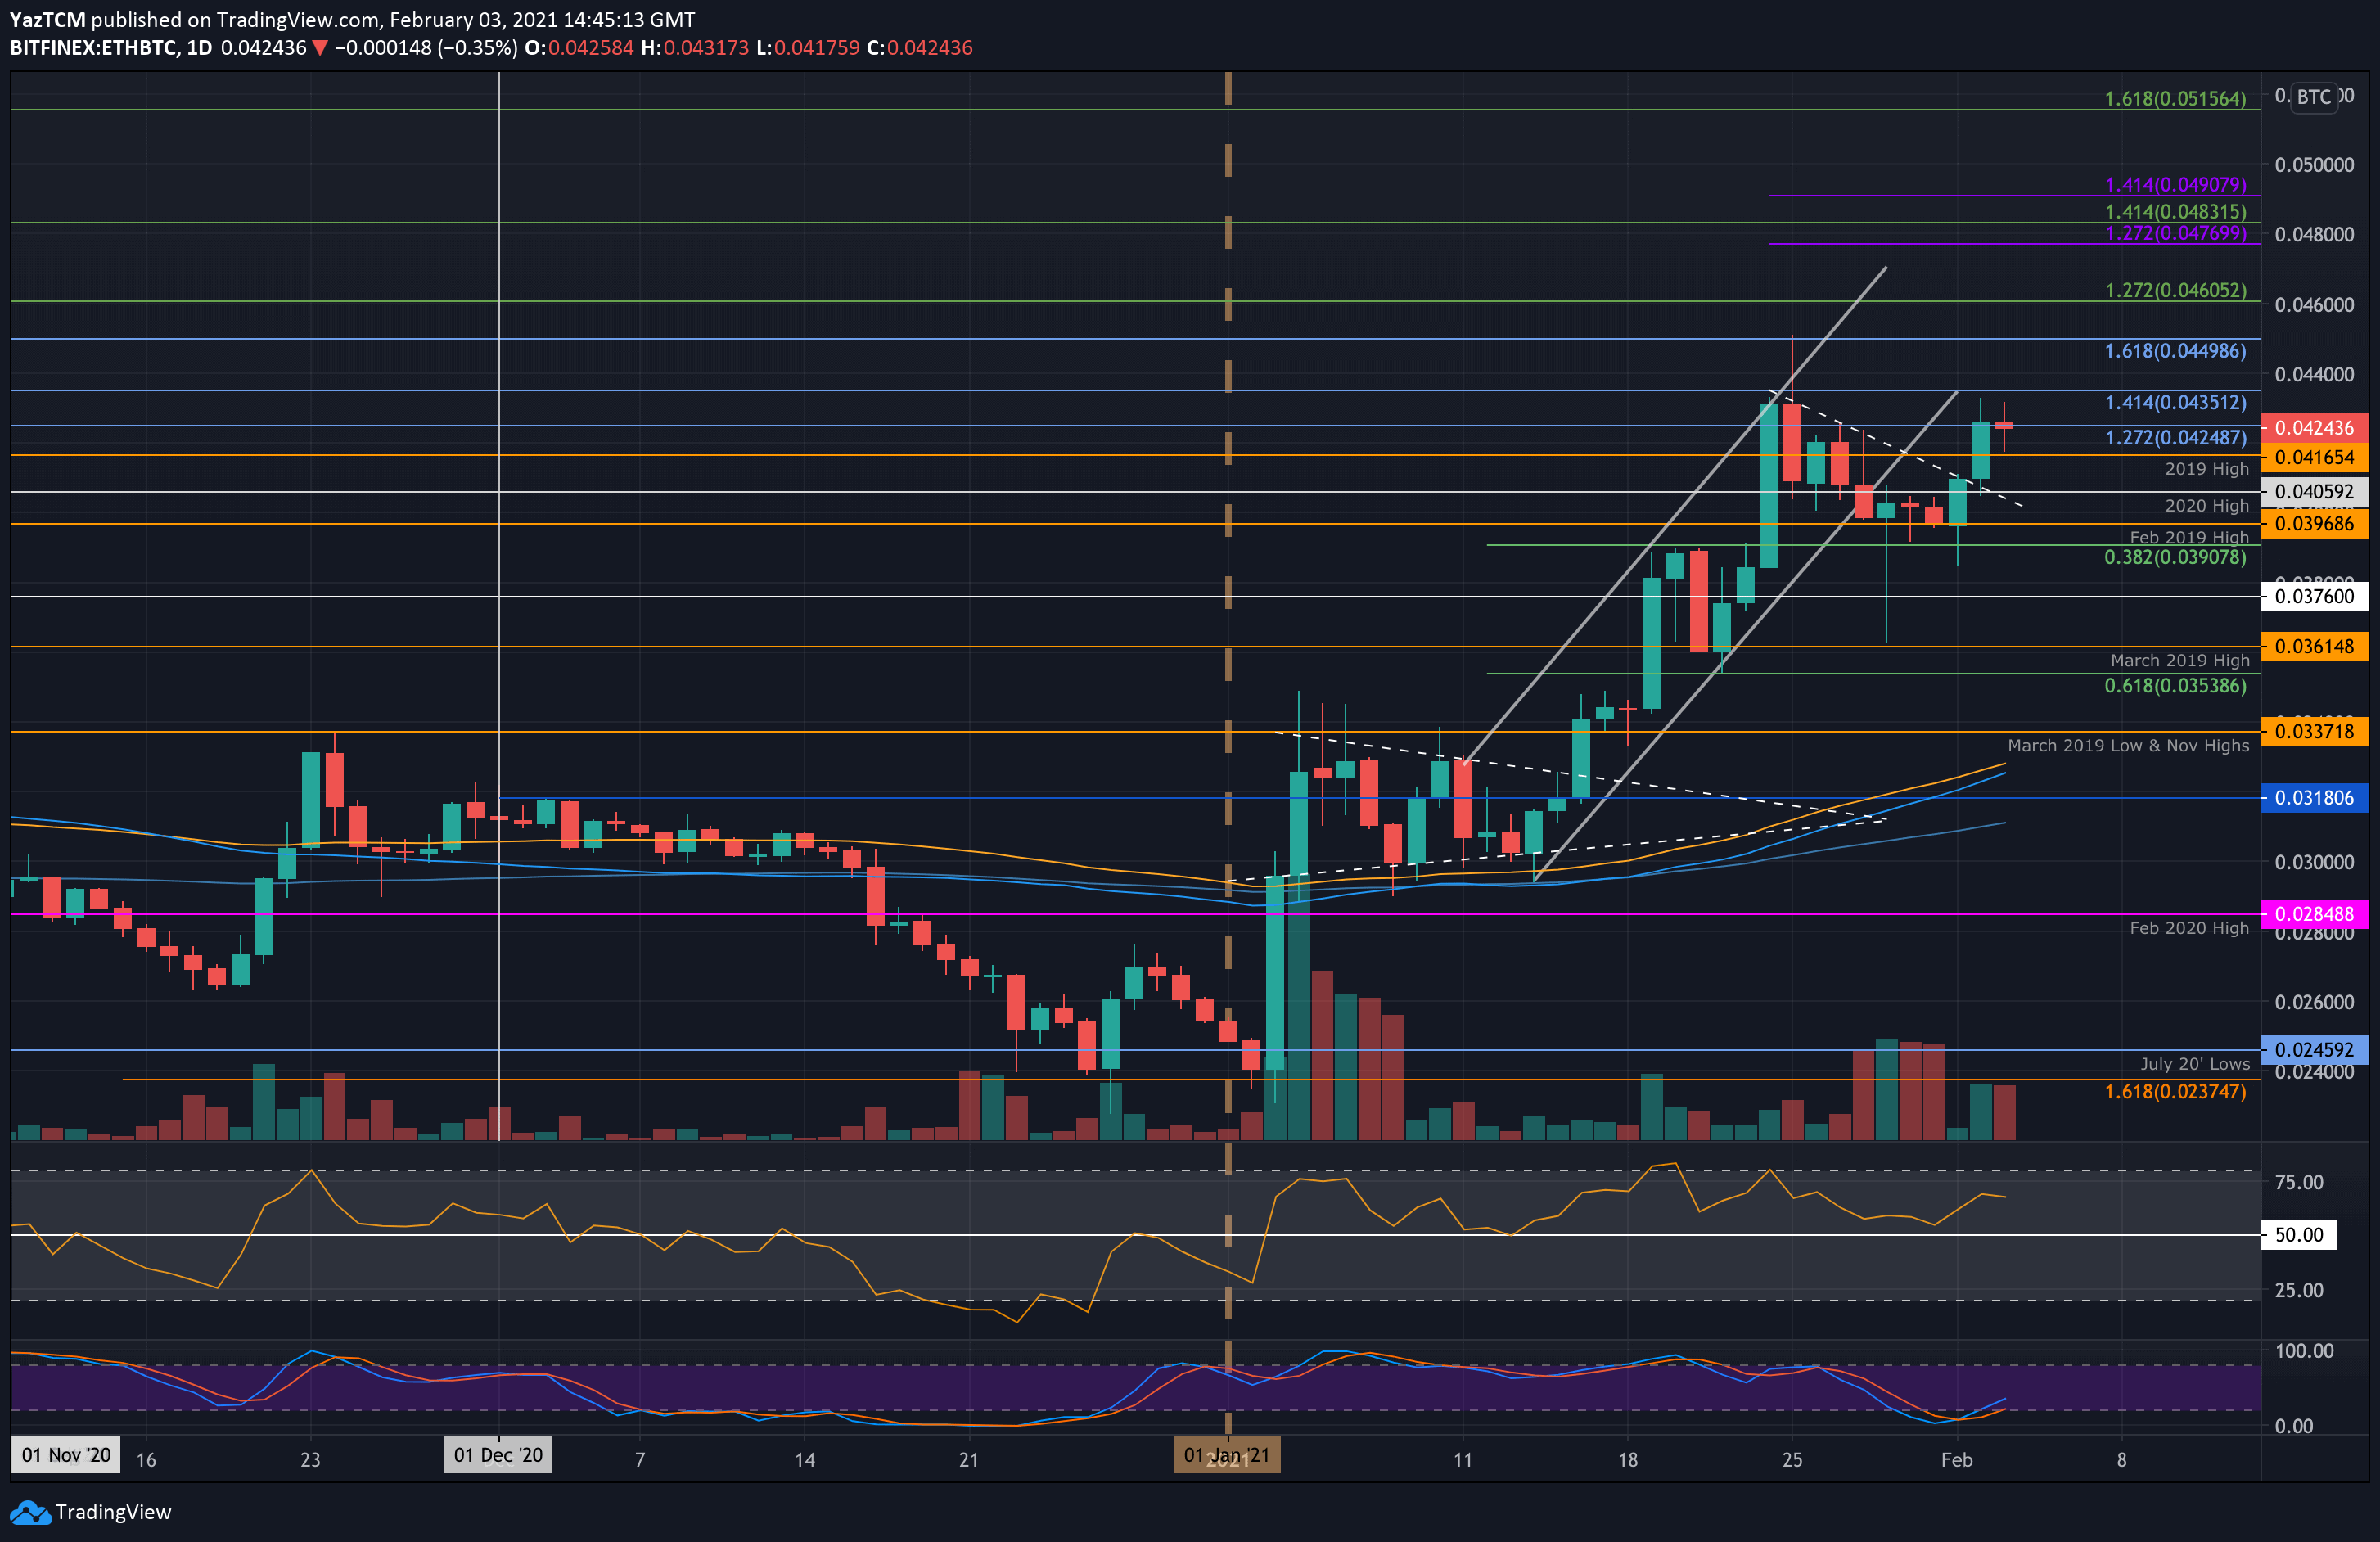
Key Support Levels: 0.0416 BTC, 0.0405 BTC, 0.0396 BTC.
Key Resistance Levels: 0.0435 BTC, 0.044 BTC, 0.045 BTC.
Against Bitcoin, ETH is also trying to push higher after reaching 0.0435 BTC yesterday. It managed to penetrate a descending trend line as it surged beyond the 2019 highs to reach 0.0435 BTC.
Today, the cryptocurrency has dropped slightly, reaching as low as the 2019 highs again. However, it has since bounced as it trades around 0.0424 BTC.
Looking ahead, the first level of resistance lies at 0.0435 BTC. This is followed by 0.044 BTC, 0.045 BTC (1.618 Fib Extension), 0.046 BTC, and 0.0477 BTC.
On the other side, support lies at 0.0416 BTC (2019 high). This is followed by 0.0405 BTC (2020 high), 0.0396 BTC (Feb 2019 High), and 0.039 BTC (.382 Fib).
The RSI is also in the bullish territory as it remains above the midline. It still has much room before the momentum is overbought, indicating ETH/BTC has room to travel higher.