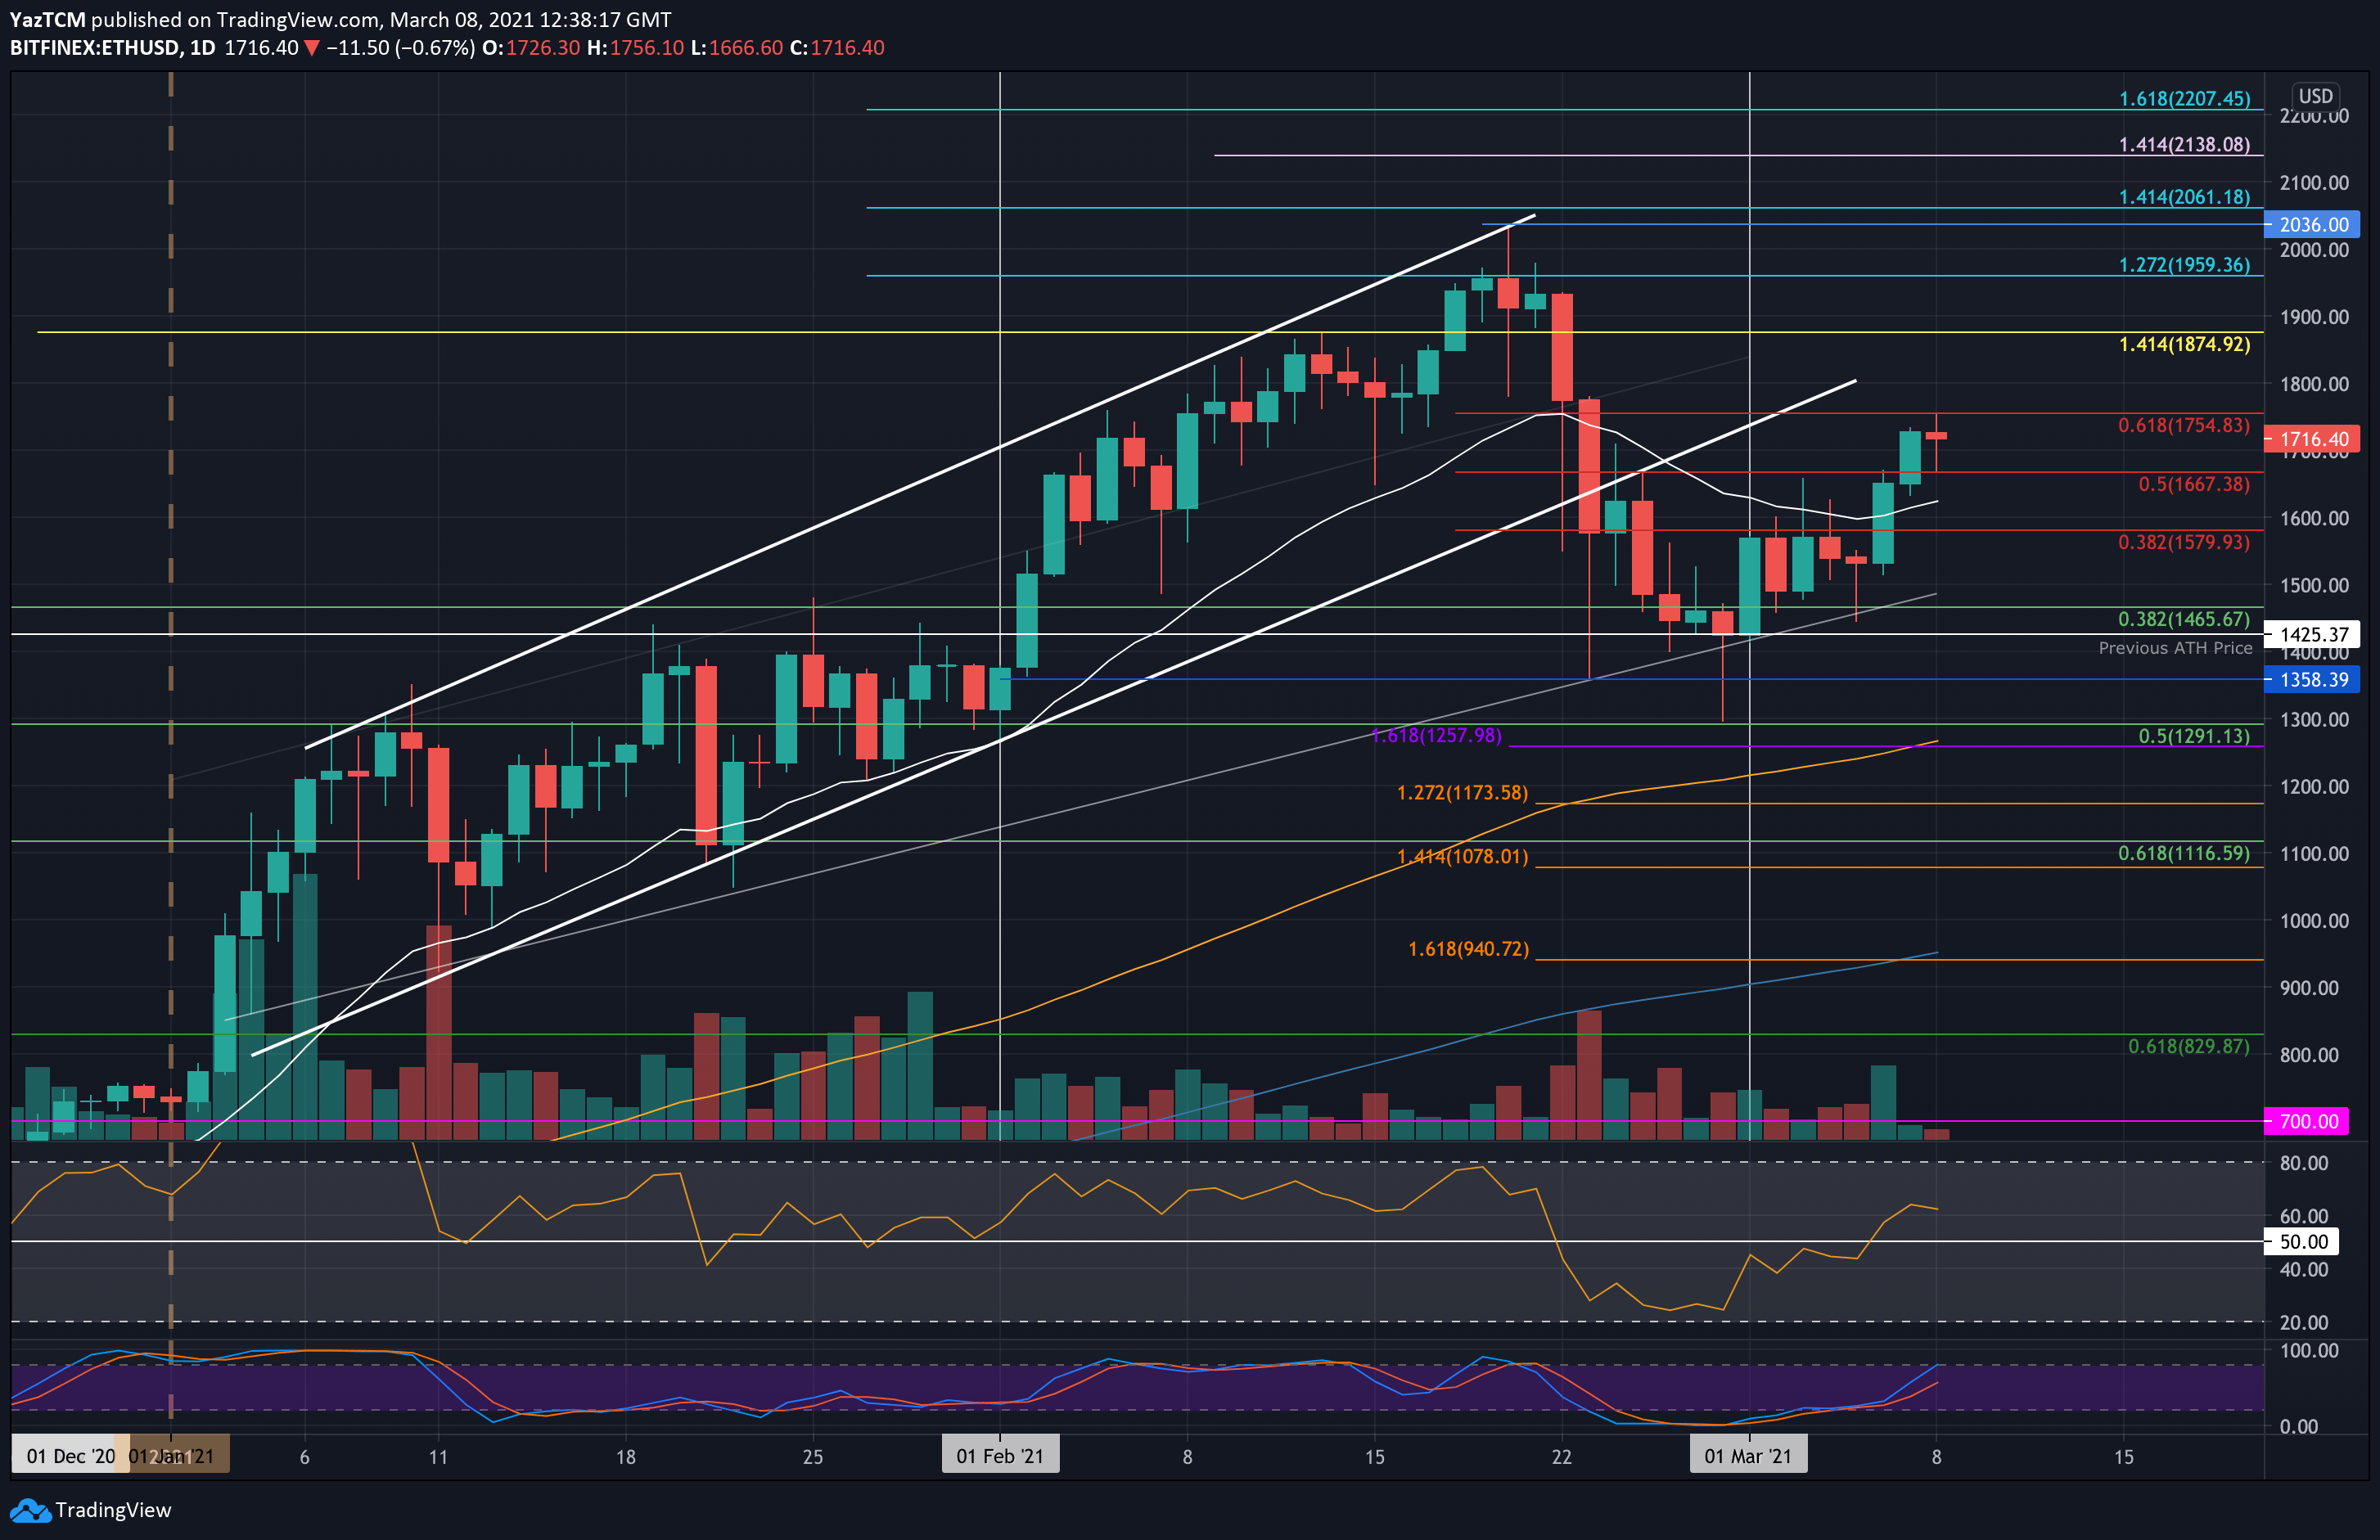
ETH/USD Daily Chart. Source: TradingView
Key Support Levels: $1680, $1620, $1500.
Key Resistance Levels: $1755, $1800, $1875.
Ethereum is now up by a total of 21.6% over the past week as it hit the resistance at $1755 today (bearish .618 Fib). The coin had started heading lower toward the end of February until it found support at $1425 (previous ATH).
It rebounded from there and it pushed higher into resistance at $1580 (bearish .382 Fib Retracement). It struggled at this level during the entire last week until the end of it when it managed to start climbing and reached $1755 today.
Looking ahead, the first level of resistance lies at $1755 (bearish .618 Fib). This is followed by $1800, $1875 (1.414 Fib Extension – yellow), $1960 (1.272 Fib Extension blue), and $2000.
On the other side, the first support lies at $1680. This is followed by $1620 (20-days EMA), $1500, and $1465 (.382 Fib).
The daily RSI is now above the midline as the buyers take control of the market momentum moving forward.
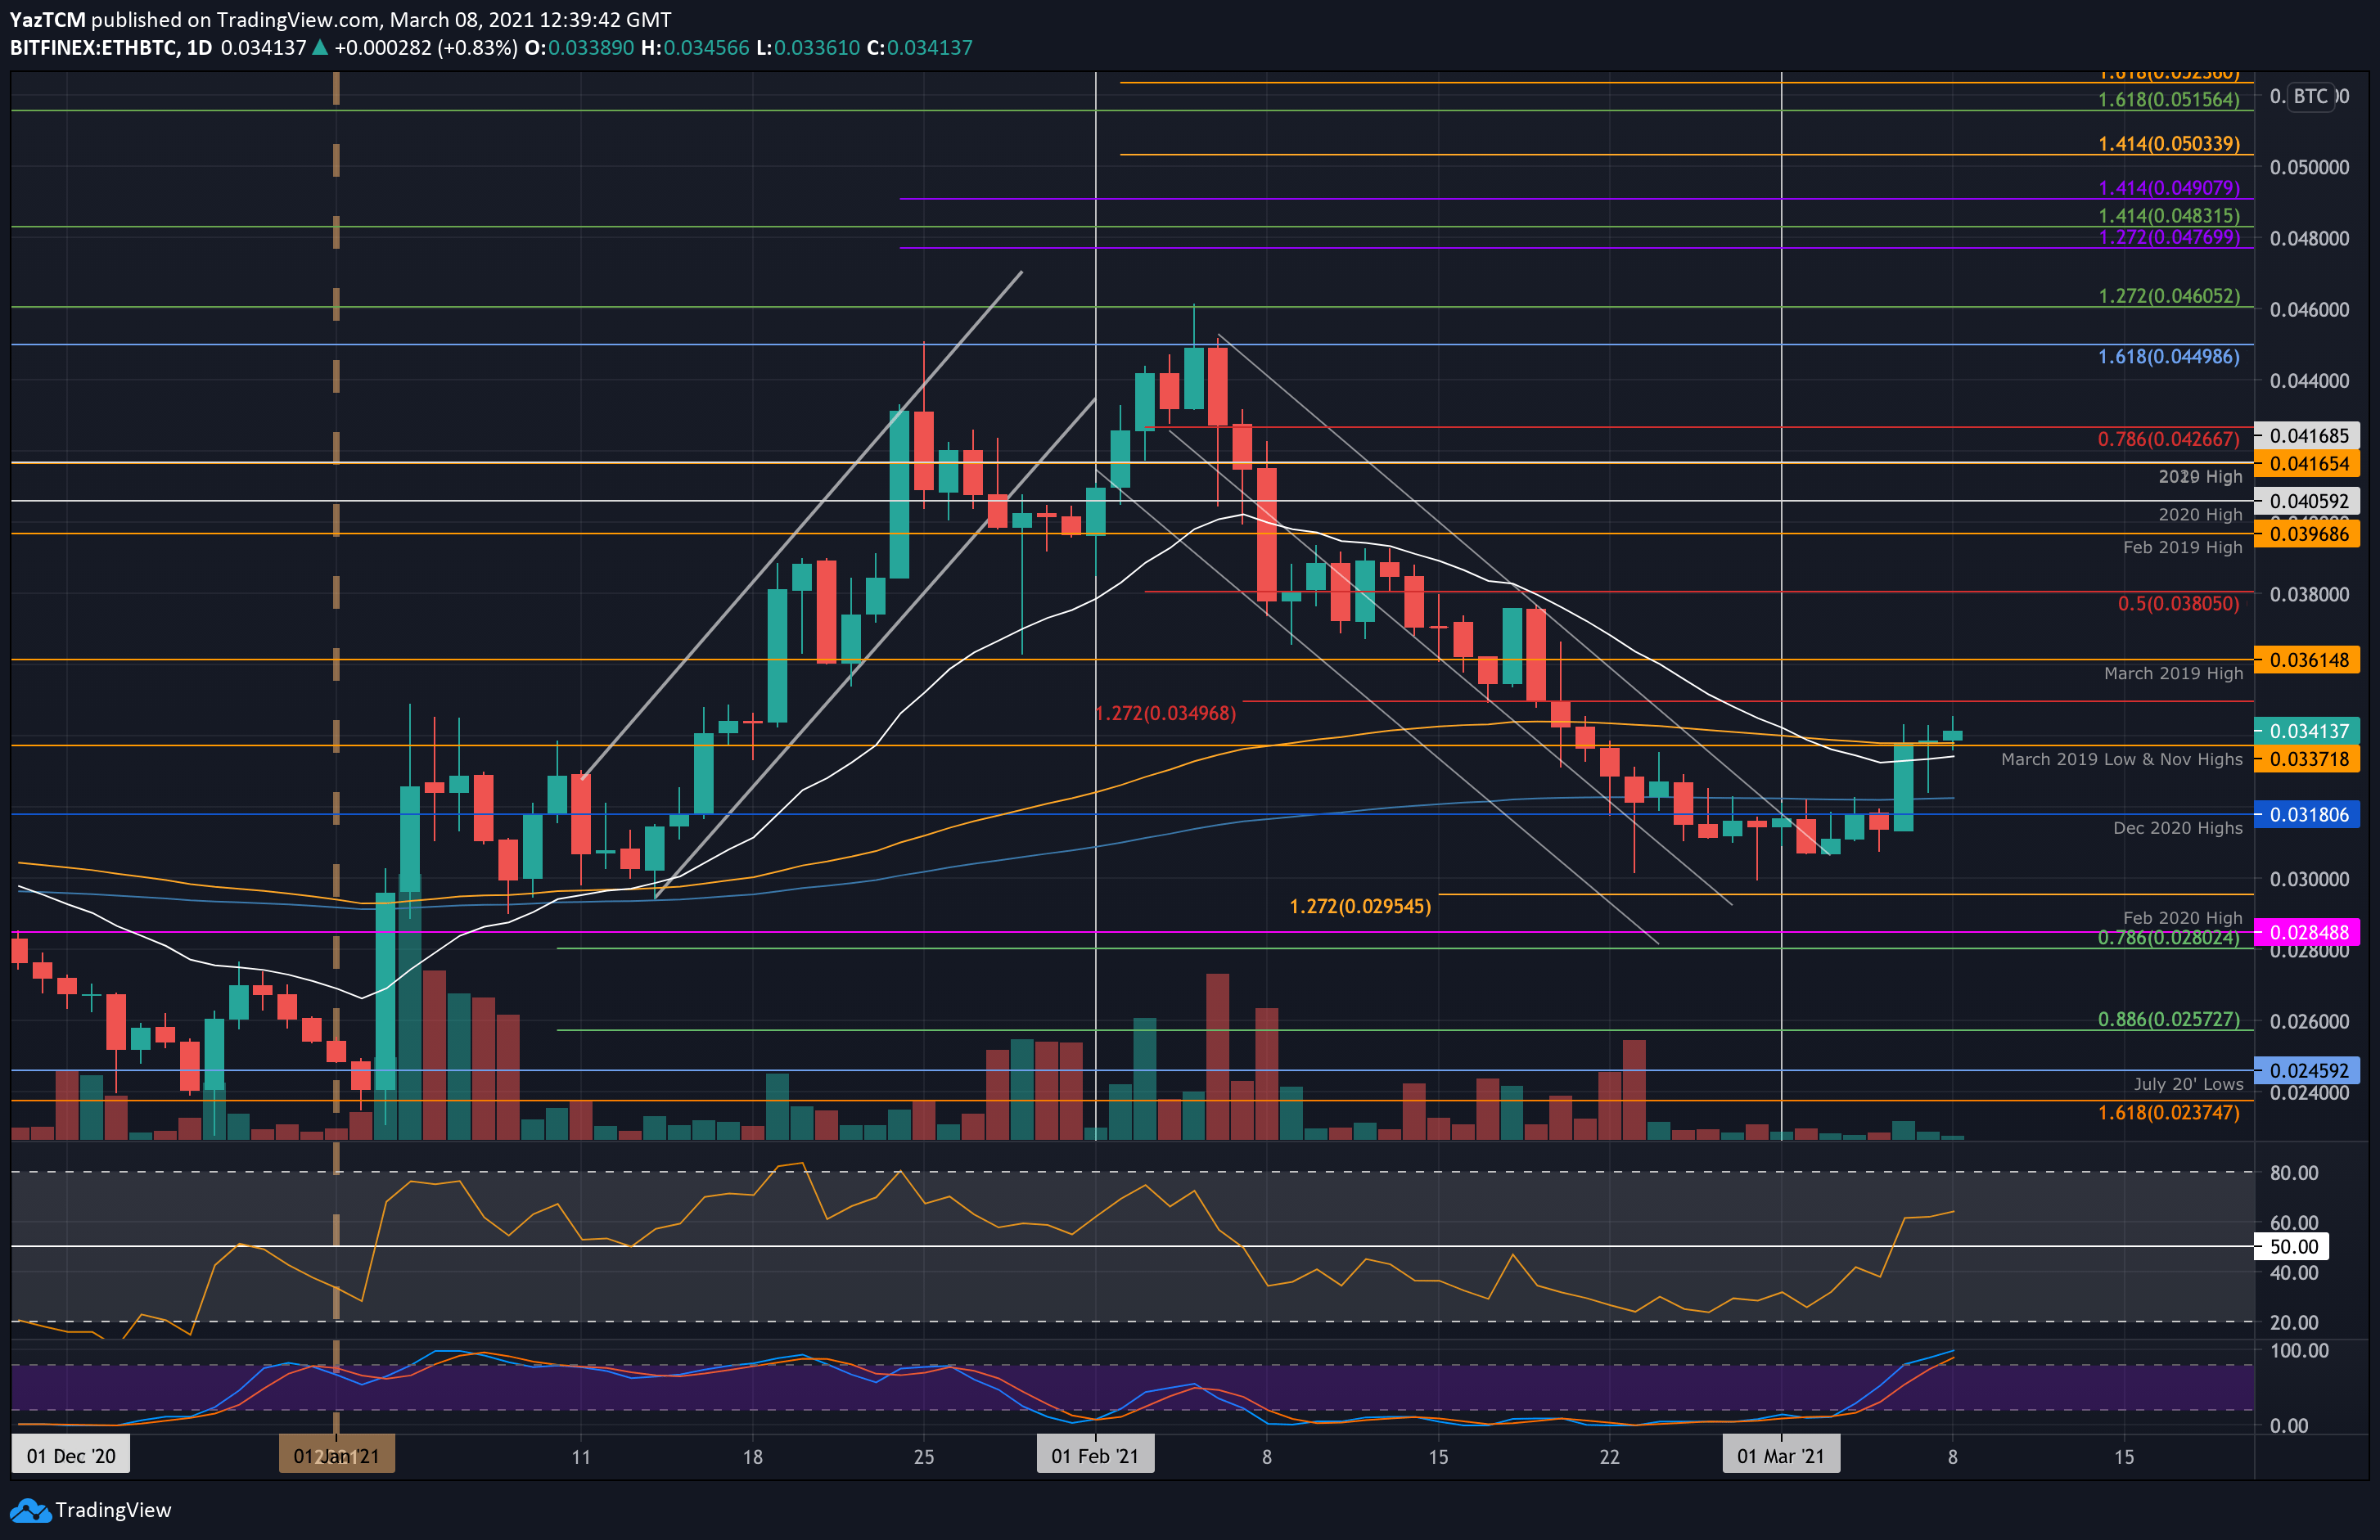
Key Support Levels: 0.0337 BTC, 0.032 BTC, 0.031 BTC.
Key Resistance Levels: 0.035 BTC, 0.0361 BTC, 0.038 BTC.
Against Bitcoin, Ethereum seems to be reversing the downtrend that it saw during February 2021. It had dropped from above 0.046 BTC to reach as low as 0.03 BTC by the end of the month.
Over the weekend, ETH managed to break above the December 2020 highs at 0.0318 BTC as it pushed higher into the Nov 2020 highs at 0.0337 BTC. Today, the buyers continued above this as they broke beyond the 100-days EMA to reach 0.0341 BTC.
Looking ahead, the first resistance lies at 0.035 BTC. This is followed by 0.0361 BTC (March 2019 Highs), 0.038 BTC (bearish .5 Fib Retracement), 0.0396 BTC (Feb 2019 Highs), and 0.0405 BTC (2020 Highs).
On the other side, the first support lies at 0.0337 BTC (100-days EMA & Nov 2020 Highs). This is followed by support at 0.032 BTC (200-days EMA), 0.0318 BTC (December 2020 Highs), 0.031 BTC, and 0.03 BTC.
Likewise, the RSI has pushed above the 50 level, indicating that the bulls are now in charge of the market momentum.