ETH/USD:
Support: $175, $171, $165.
Resistance: $180, $188, $194.
ETH/BTC:
Support: 0.025 BTC, 0.0247 BTC, 0.024 BTC.
Resistance: 0.0259 BTC, 0.0263 BTC, 0.027 BTC.
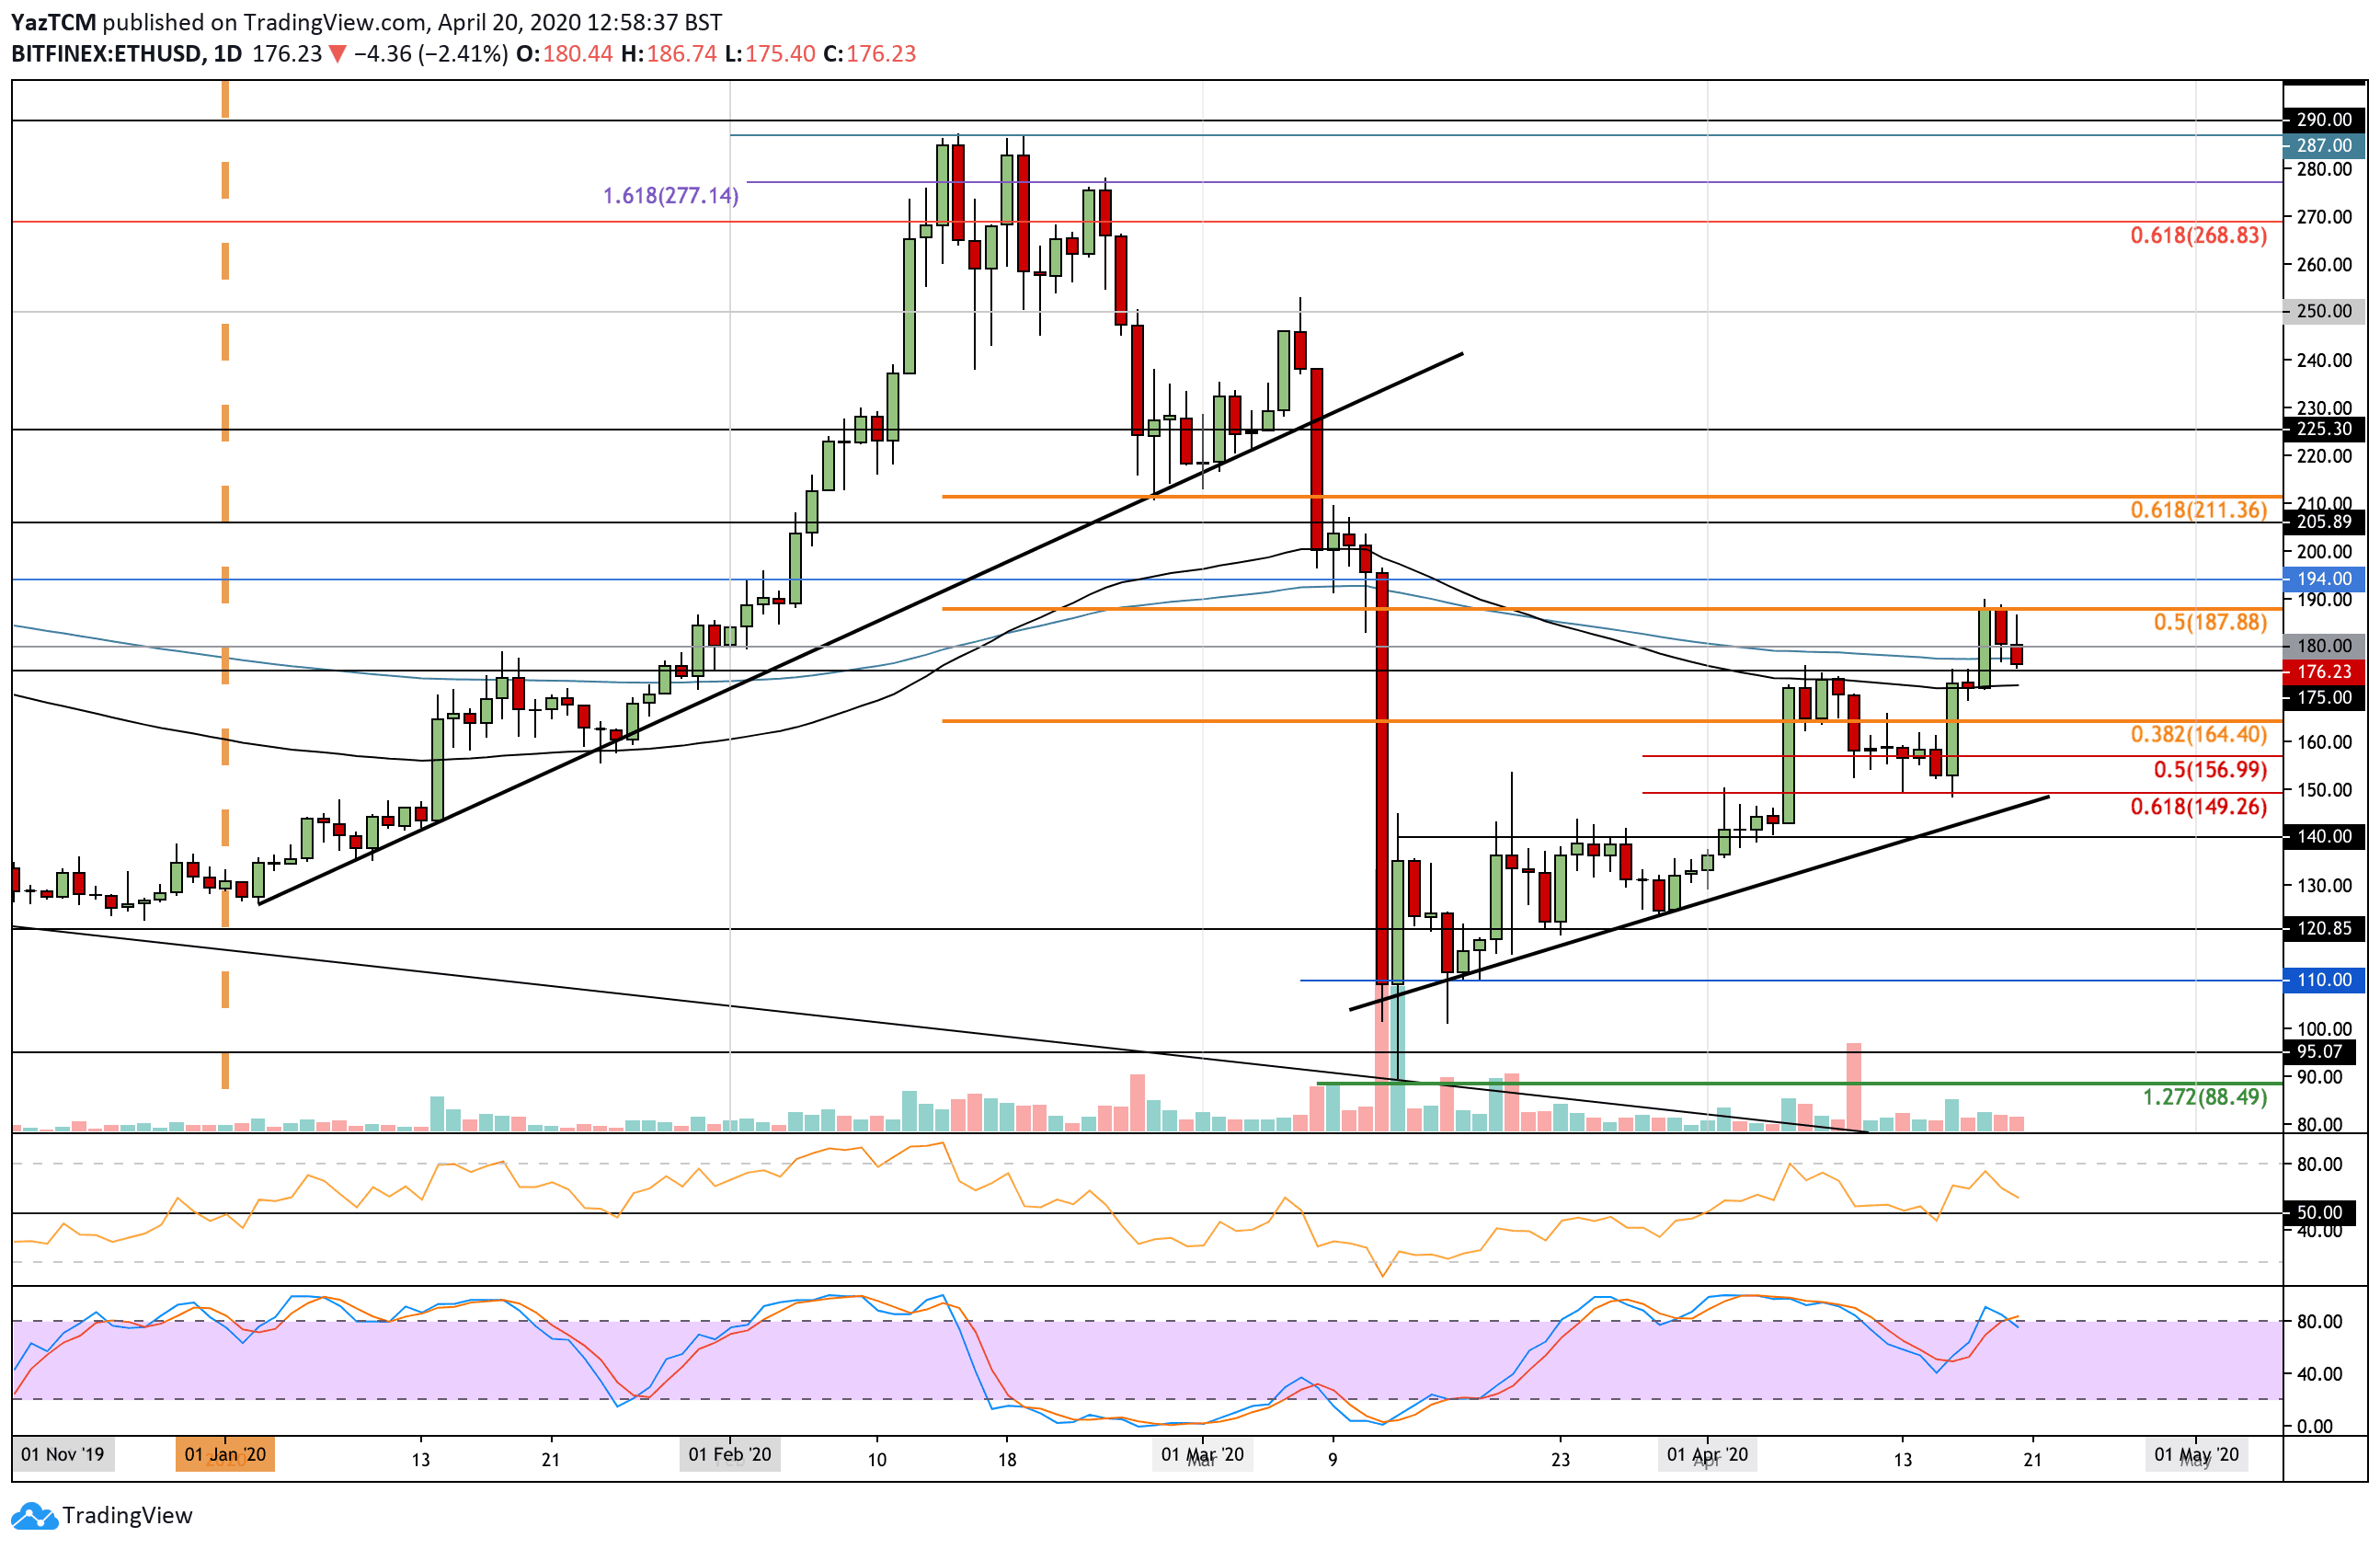
Ethereum had surged by a total of almost 17% over the past week of trading, which allowed it to break above the 200-days EMA and reach a high of $188 where it met resistance at a bearish .5 Fibonacci Retracement level – measured from the February’s high to the March low.
It since dropped from here but has managed to find support at the $175 level.
Looking ahead, if the buyers can break above $175, resistance is located at $180 and $188. Above this, higher resistance is located at $194, $200, and $211 (bearish .618 Fib Retracement).
Alternatively, if the sellers break $175, support lies at $171 (100-days EMA), $165, $157 (.5 Fib Retracement), and $150 (.618 Fib Retracement).
The RSI is falling, which is a sign that the bullish momentum is fading. However, if it can remain above the 50 line, ETH can be expected to rebound.
Against Bitcoin, Ethereum rebounded from the 0.023 BTC level and reached as high as 0.026 BTC over the weekend.
Here, it found resistance at a bearish .786 Fibonacci Retracement level, which caused the coin to drop slightly into the current 0.0252 BTC level.
If the sellers continue to drive ETH lower, the first level of support lies at 0.025 BTC. Beneath this, support is located at 0.0247 BTC, 0.024 BTC, and 0.023 BTC (.5 Fib Retracement).
Alternatively, if the bulls can keep above 0.025 BTC, the first level of resistance is located at 0.026 BTC. Above this, resistance is located at 0.0263 BTC, 0.027 BTC, and 0.0278 BTC (2020 high-day closing price).
The RSI is still showing strong bullish momentum. However, the Stochastic RSI is looking overbought, and a bearish crossover signal is likely to send the market lower.