Source: TradingView
Ethereum’s price has begun an aggressive uptrend since the rebound from the lower boundary of the large bullish flag pattern, breaking past several resistance levels. Yet, the price has finally struck a significant obstacle in the $2,400 resistance zone.
By TradingRage
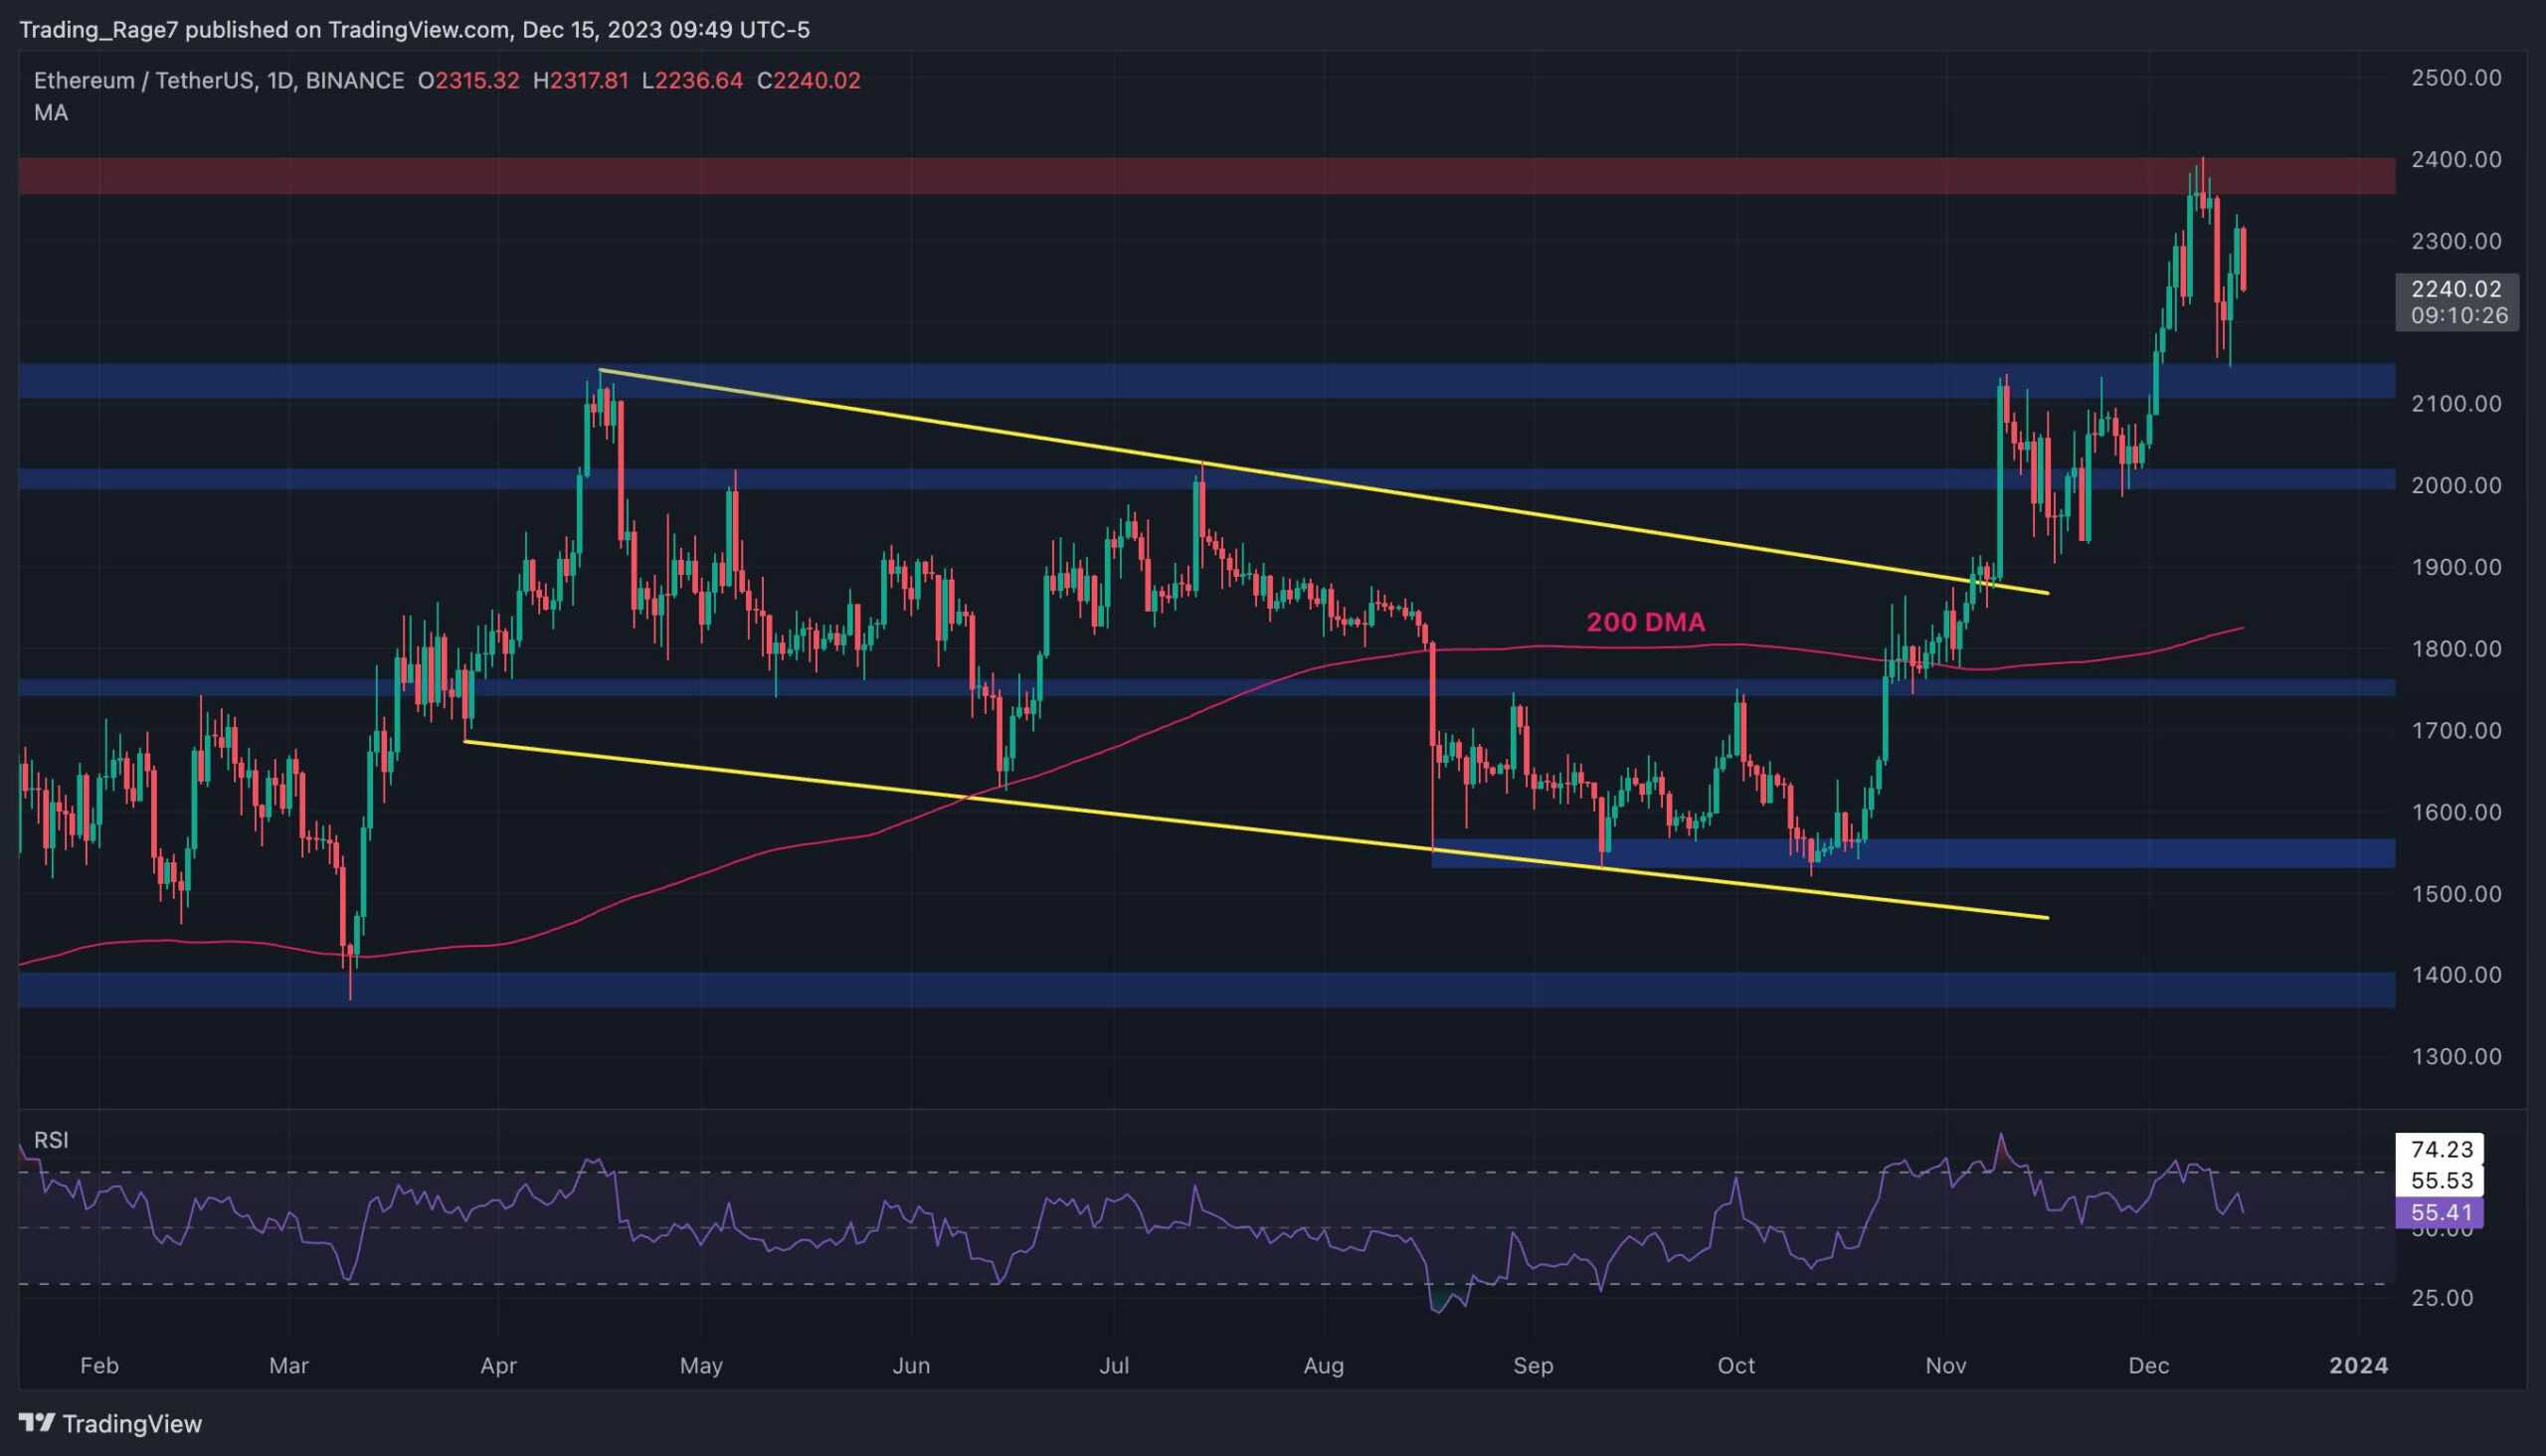
As the daily chart demonstrates, the price has been very bullish since October. The market has also broken above the 200-day moving average once again, which is a key trend indicator. As the ETH price climbed above the moving average, the trend officially shifted bullish once again.
Yet, the $2,400 area is currently preventing ETH from rallying further. At the moment, the market is likely to retest the $2,100 or even the $2,000 support level. These levels might likely initiate a bullish rebound in price, and ETH can potentially aim for values higher than $2,400 in the coming weeks.
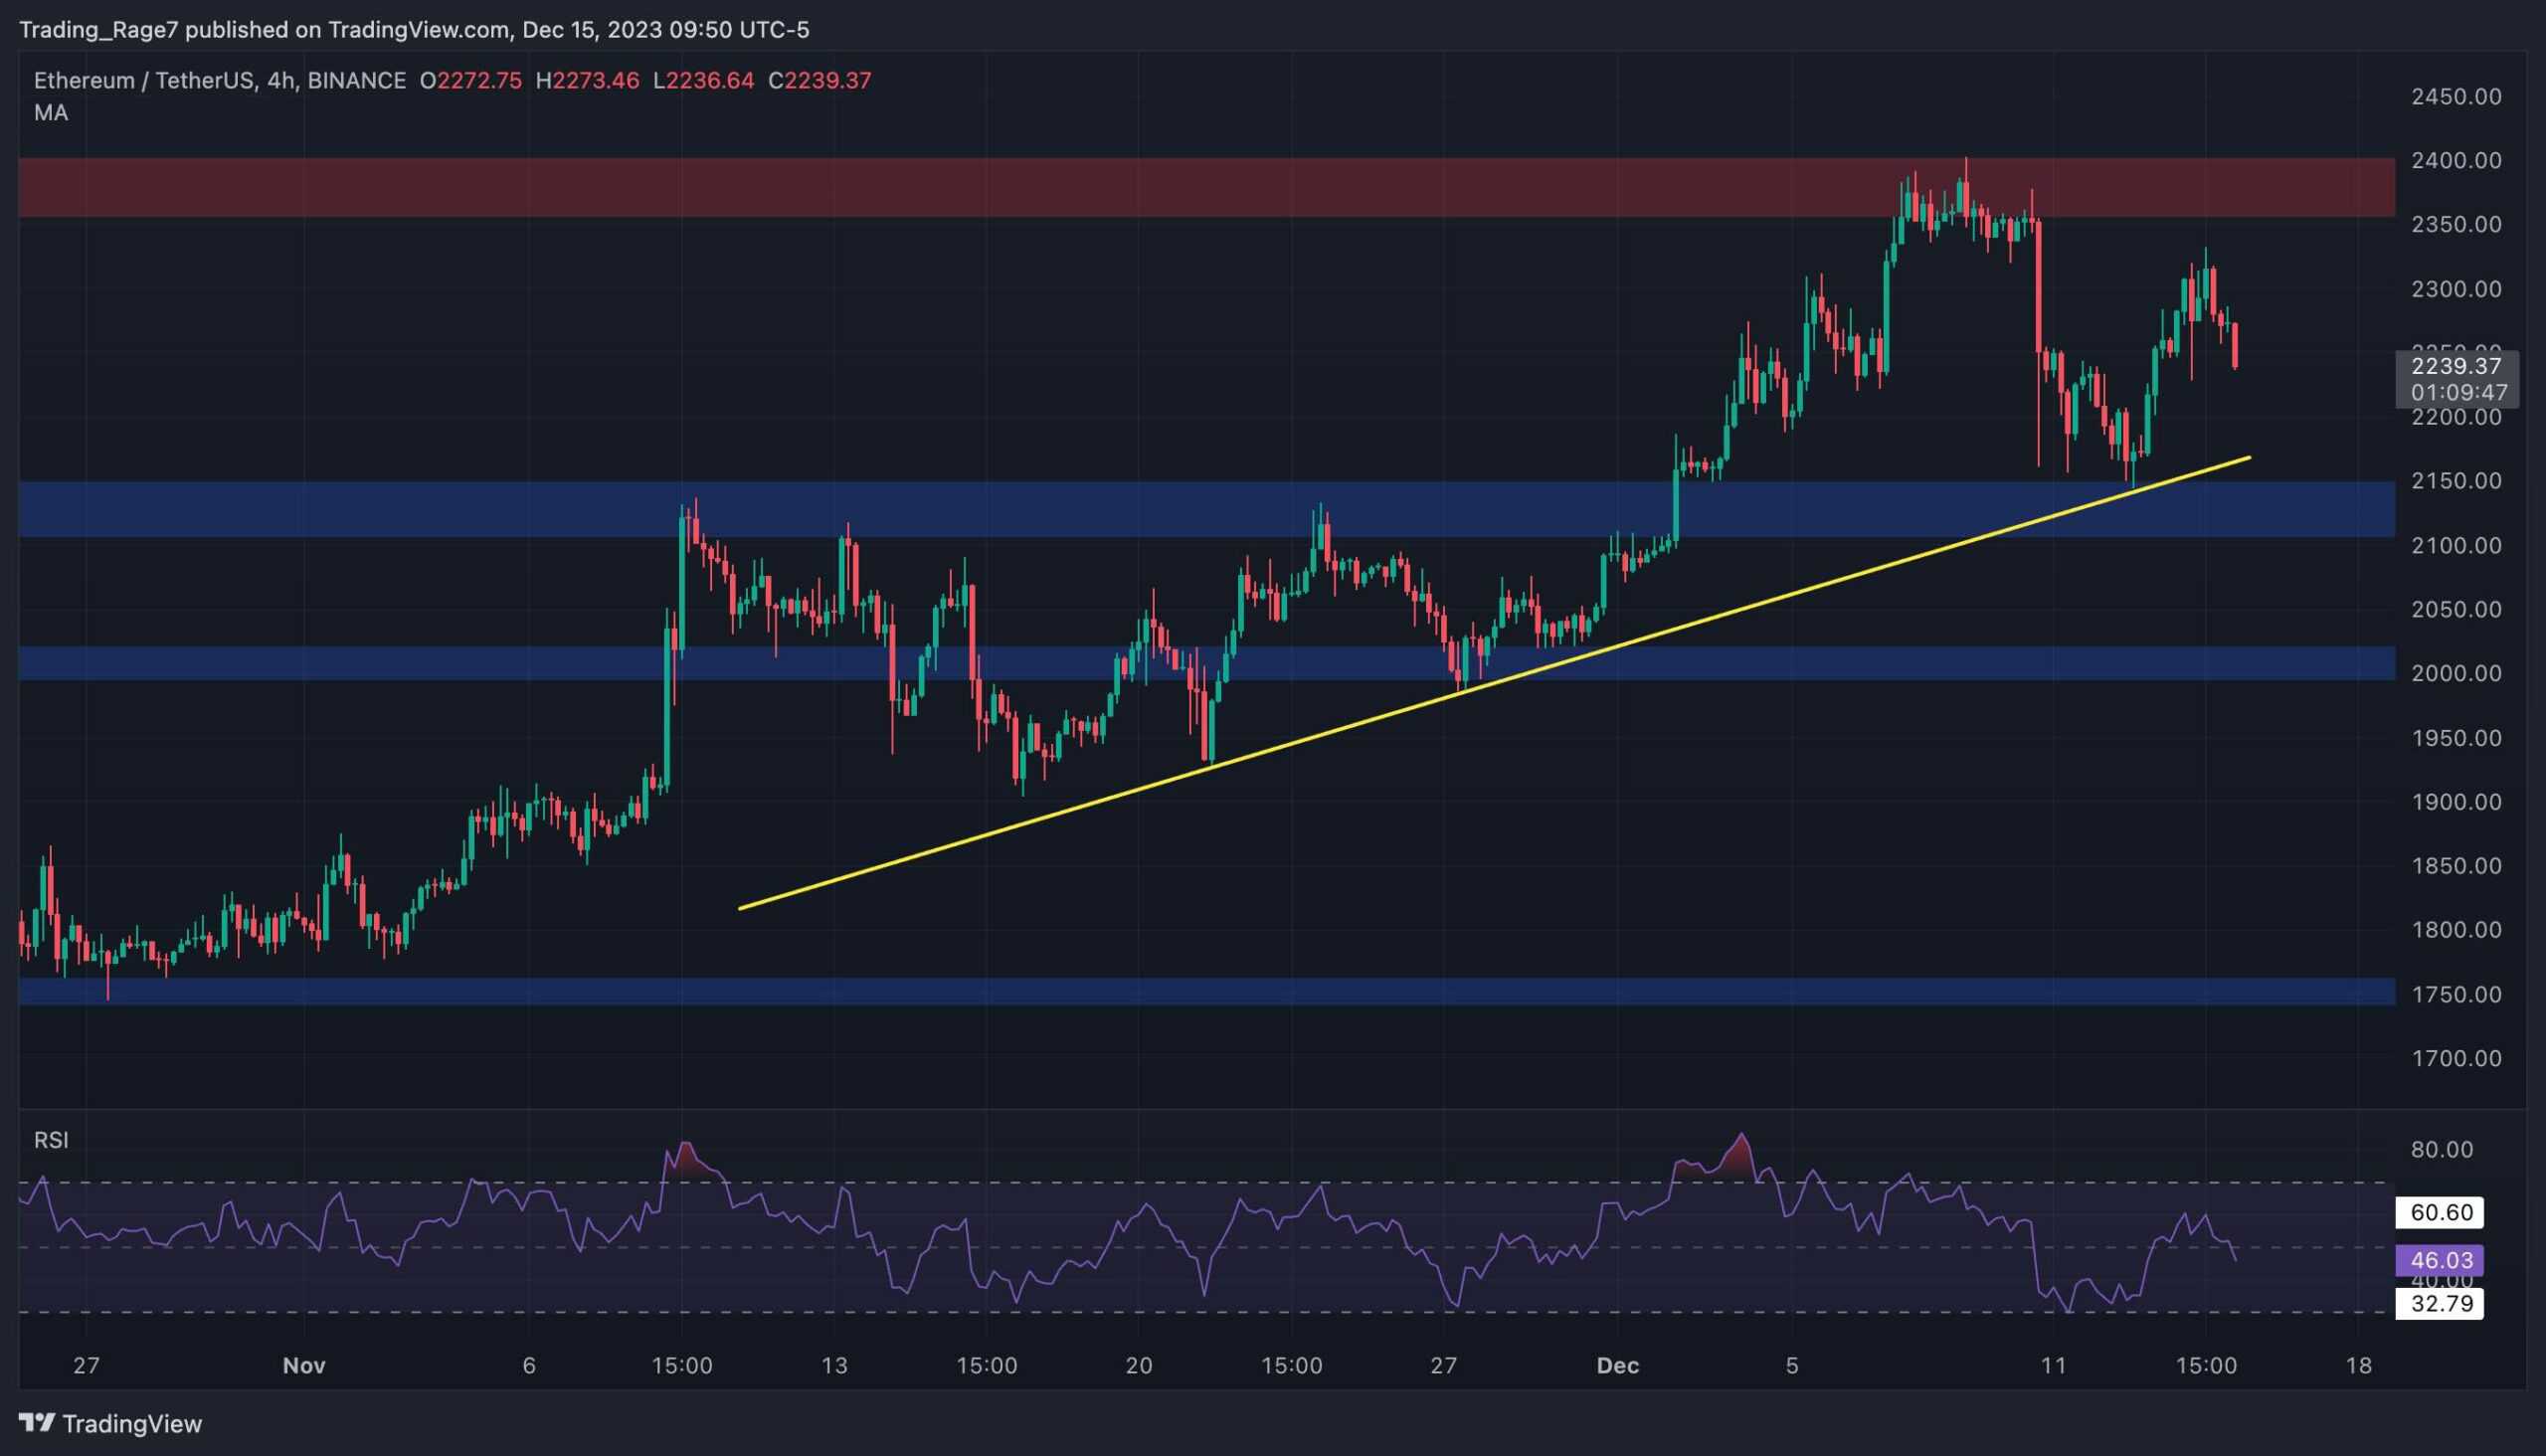
On the 4-hour chart, things become a little more tricky. The price has been reacting precisely to the depicted bullish trendline over the past few weeks.
However, it is currently falling toward the trendline once more. While traders can expect another rebound from this level, there is also a possibility for a breakdown. In the latter case, things might turn for the worse and lead to a deeper correction in the near future.
By TradingRage
Ethereum’s price has been on a steady rise over the last few months, going from below $1,000 per coin to over $2,000. Meanwhile, futures market sentiment analysis can yield beneficial insights to investors.
This chart represents the open interest metric for all exchanges. It counts the number of open futures contracts on all exchanges, no matter the direction of the trade. Therefore, higher values indicate that futures traders are confident in the trend’s direction, while low values show uncertainty. Moreover, the higher the open interest is, the more volatile the price action gets as the probability of liquidation cascades increases.
As the chart depicts, while the price has been trending higher, the open interest has also been consistently rising. However, the metric is yet to show huge spikes and is gradually increasing. This behavior signals that the current uptrend can be a sustainable one, as the futures market is not overheating yet.