Ethereum has continued to trade sideways over the past few days as the market anticipates the upcoming hard forks, which will take place in a few hours. The market is trading at $140, at the time of writing and is up by 30% over the past 30 days. The Ethereum network upgrade will occur at block 7,280,000 and will implement the Constantinople and the St Petersburg upgrades into the Ethereum blockchain.
Constantinople has much been much anticipated after the recent setbacks upon the finding of an error in the code, which caused a 45 days delay. However, St Petersburg is set to patch this bug allowing the upgrade to process. Constantinople has been described as a maintenance and optimization upgrade as the Ethereum blockchain heads toward an increase in its scalability. The upgrade will also see a third reduces the mining block reward from 3 ETH per block to 2 ETH.
Looking at the ETH/USD 4HR Chart:
- Following our last Ethereum analysis, we can see that Ethereum had continued to trade above the previously mentioned support at $135.
- Ahead of the upcoming network upgrade, scheduled today, ETH/USD has been trading within the tight range of $135 and $142.63.
- From above: The nearest resistance above the range is located at $152.15 and further is the bearish .886 Fibonacci Retracement level at $160 (marked in red). Further lies the significant resistance at $170.80, and $185.
- From below: The nearest support lies at $135. If the sellers break beneath $130, then further support below is expected at the short term .618 Fibonacci Retracement at $128.20 (marked in green).
- Support beneath lies at $120, $117 and $110.
- The RSI is trading around the 50 zone as the market is indecisive for the next move.
- The trading volume has decreased ahead of the network upgrade.
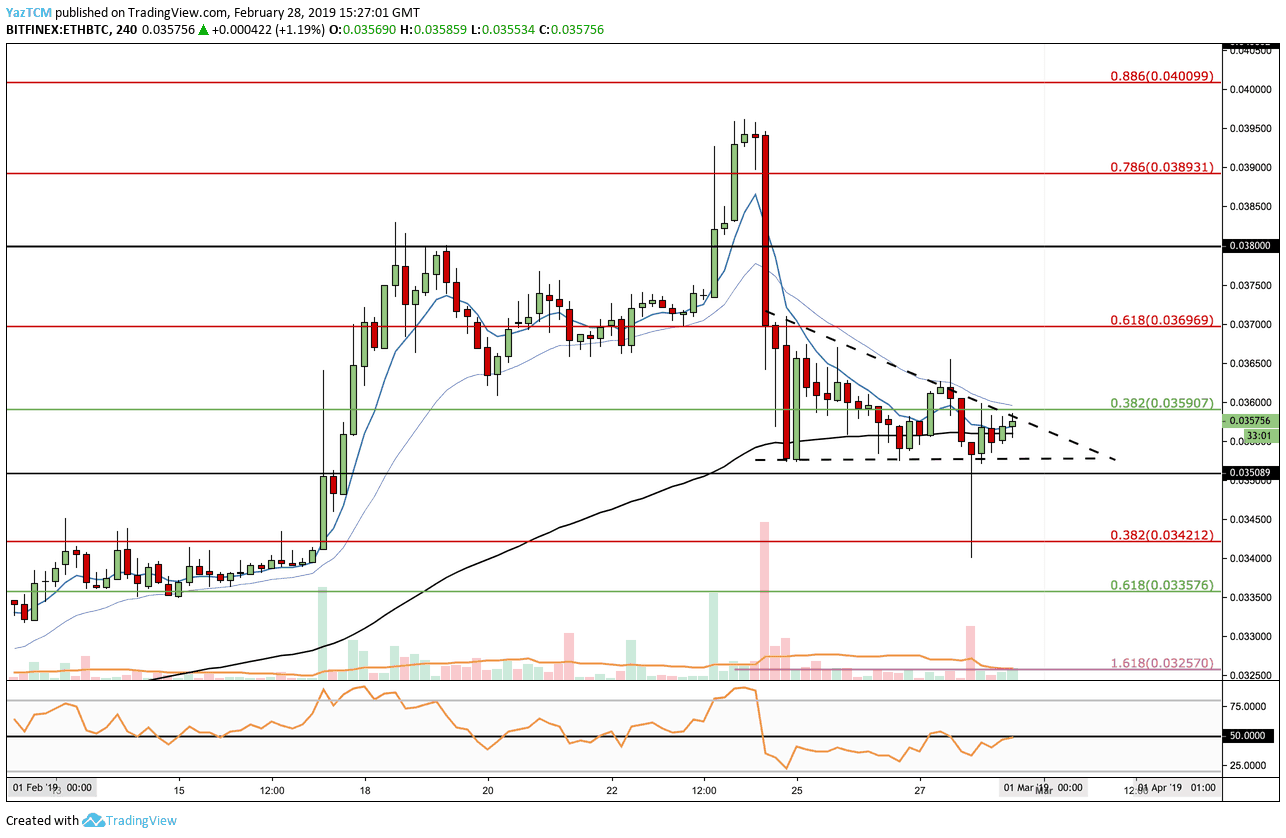
Looking at the ETH/BTC 4HR Chart:
- Over the past few days, ETH/BTC has held the support at 0.035 BTC.
- The market has established a short term descending triangle and is approaching the apex where a breakout is expected.
- From above: If the bulls break above the triangle, the nearest resistance lies at 0.0365 BTC and the bearish .618 Fibonacci Retracement at 0.03696 (marked in red). Higher resistance lies at 0.038 BTC, 0.03893 BTC, and 0.040 BTC.
- From below: The nearest support is the lower boundary of the triangle. Further support below lies at 0.035 BTC, 0.0342 BTC and 0.03357 BTC.
- The RSI is also at the 50 zone on this market.
- The trading volume is very low ahead of the fork.
SPECIAL OFFER (Sponsored)
LIMITED OFFER 2024 for CryptoPotato readers at Bybit: Use this link to register and open a $500 BTC-USDT position on Bybit Exchange for free!
Disclaimer: Information found on CryptoPotato is those of writers quoted. It does not represent the opinions of CryptoPotato on whether to buy, sell, or hold any investments. You are advised to conduct your own research before making any investment decisions. Use provided information at your own risk. See Disclaimer for more information.
Cryptocurrency charts by TradingView.